Table of Contents (Start)
SevOne NMS 5.4 Quick Start Guide - CallManager
SevOne NMS Documentation
All SevOne NMS user documentation is available online from the SevOne Support website.
-
Enter email address and password.
-
Click Login.
-
Click the Solutions icon.
© Copyright 2015, SevOne Inc. All rights reserved. SevOne, SevOne PAS, SevOne DNC, Deep Flow Inspection, and Rethink Performance are either registered trademarks or trademarks of SevOne Inc. Other brands, product, service and company names mentioned herein are for identification purposes only and may be trademarks of their respective owners.
Introduction
This document describes the best practices for SevOne NMS users to implement and manage the polling of CallManager data from your network.
CallManager is the IP telephony call processing component of the Cisco Unified Communications solution which enables you to monitor the Cisco Unified Communications Manager (formerly Cisco Unified CallManager).
In SevOne NMS, plugins are mechanisms that poll (collect, ask for, etc.) data from technologies. Plugins define a way to get data, usually via some protocol such as SNMP, ICMP, WMI, etc. Many plugins are automatically enabled when you add a device to SevOne NMS so you can poll applicable objects with minimal configuration. CallManager requires device specific input.
Objects are discrete components of a device or a software component that have one or more performance indicators on which SevOne NMS can monitor, trend, and alert. SevOne NMS considers an element to be any performance object. Indicators are grouped by indicator types which in turn are grouped by object types.
-
Object Types - Define logical things to ask for information about.
-
Indicator Types - Define kinds of metrics that object types can have.
The CallManager plugin enables you to monitor real time performance counter, and database information of the Cisco Unified Communications Manager including statistics such as calls active, attempted, and completed on the cluster. The CallManager plugin also monitors statistics such as the performance of remote gateways, conference calling resources, and system performance counters such as memory, CPU, and disk space.
Enable Devices to CallManager Data to SevOne NMS
This chapter describes how to enable devices to send CallManager data to SevOne NMS. This workflow is outside of the SevOne NMS application and may not present all of the steps your network requires to enable devices to send CallManager data. If these instructions are not applicable for your network please reference the device manufacturer's documentation.
You start and stop the AXL web service from Cisco Unified Communications Manager Serviceability. The service is disabled by default. You should start the service before you use the AXL APIs.
-
From the Cisco Unified Communications Manager Administration window, click Navigation then click Cisco Unified Communications Manager Serviceability.
-
Click Tools then click Service Activation.
-
From the Server box, select the server and click Go.
-
From Database and Admin Services, select Cisco AXL Web Service.
-
Save your changes.
When the AXL service starts, AXL deploys as a web application within Apache Tomcat. The WAR file deploys to Tomcat under
/usr/local/thirdparty/jakarta-tomcat/webapps/axl
Enable CallManager Plugin
The CallManager plugin requires device specific configuration and is therefore disabled on new devices by default. The Device Manager provides access to the Edit Device page where you enable and configure the CallManager plugin for each device.

Perform the following steps to enable the CallManager plugin for each device from which to discover CallManager objects and to poll CallManager metrics.
-
From the navigation bar, click the Devices menu and select Device Manager to display the Device Manager.
-
Click
 next to a device to display the Edit Device page.
 -
In the plugin section (displays SNMP by default), click the drop-down and select CallManager.
-
Select the CallManager Capable check box to enable discovery of the CallManager object types and to poll CallManager data on the device.
-
Click the Version drop-down and select the CallManager version.
-
In the CTI ID field enter the computer telephone integration (CTI) identifier.
-
In the Port field, enter the port number on the device for SevOne NMS to use to poll CallManager data.
-
In the Host Name field, enter the host name. If SevOne NMS cannot directly communicate with the CallManager, you must add the host name of a device that the CallManager can recognize. If there is direct communication with the CallManager, then the host name is the same as the IP address.
-
In the Username field, enter the user name SevOne NMS needs to authenticate onto the device.
-
In the Password field, enter the password SevOne NMS needs to authenticate onto the device.
-
Click the Publisher drop-down and select the device to be the publisher.
-
Select the Use HTTPS check box if the Cisco Unified Communications Manager Administration is a secure site.
-
Click Edit Indicator Types to Monitor to display the Indicator Type Map page where you select to enable or disable the CallManager indicator types to poll on the device. Note the legend/explanation for the indicators.
-
Bold - The CallManager plugin polls the indicator by default when discovered on a device.
-
Italic - The indicator's object type is enabled from the Object Types page.
-
Normal - The indicator's object type is disabled and the indicator is not being polled.
-
-
Select the check box for each indicator to attempt to poll on the device.
Manage CallManager Object Types and Indicator Types
The CallManager plugin discovers the CallManager object types on the devices you enable to send CallManager data to SevOne NMS. Some CallManager object types are enabled by default. The Object Rules page enables you to define rules to disable polling of objects and the Object Manager enables you to manage the objects on each device. The Object Types page enables you to manage CallManager object types and indicator types.
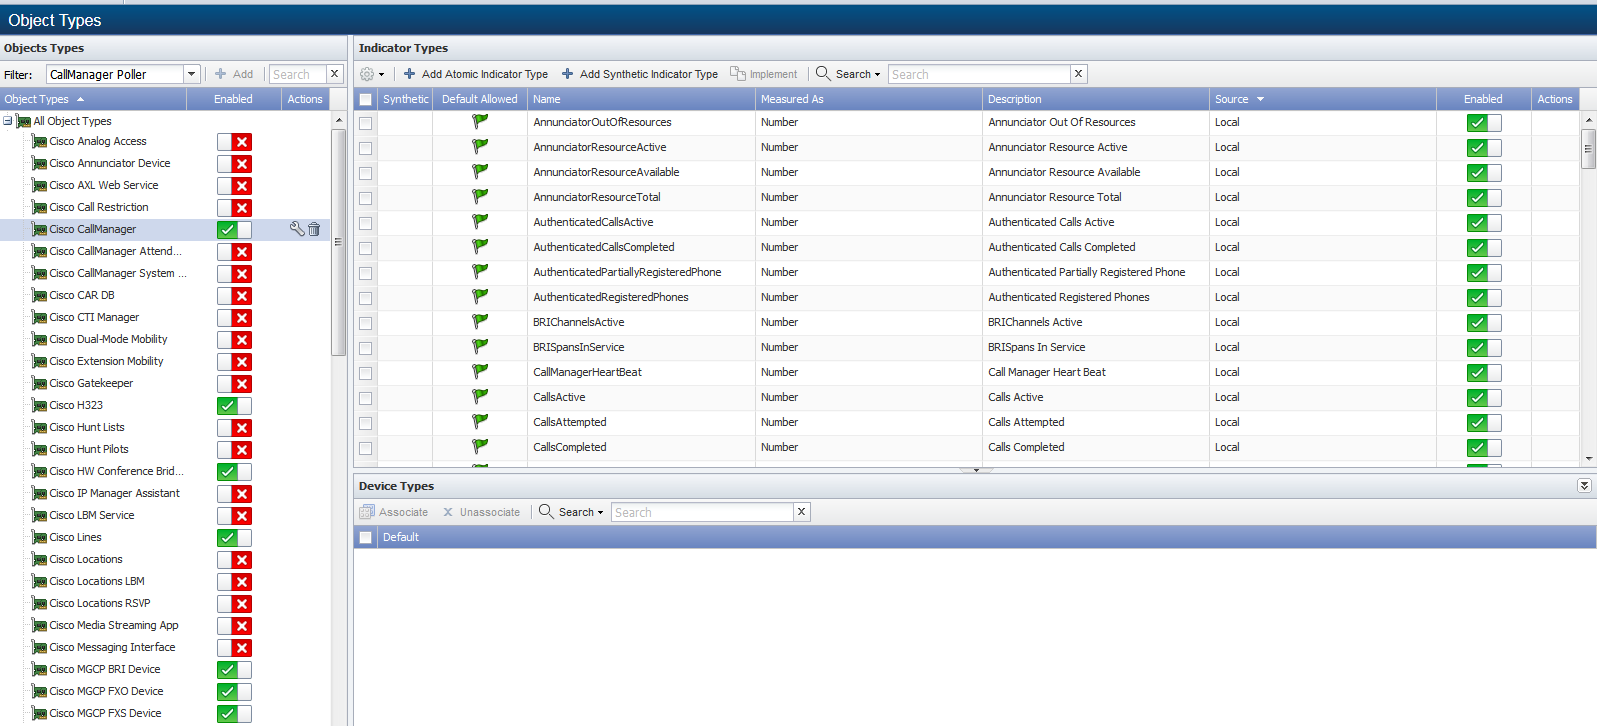
To access the Object Types page from the navigation bar, click the Administration menu, select Monitoring Configuration, and then select Object Types.

Click the Filter drop-down and select CallManager Poller to display the object types the CallManager plugin can poll in the Object Types hierarchy on the left.
Manage CallManager Object Types
Perform the following steps to manage CallManager object types.

-
Above the Object Type hierarchy, click Add or click
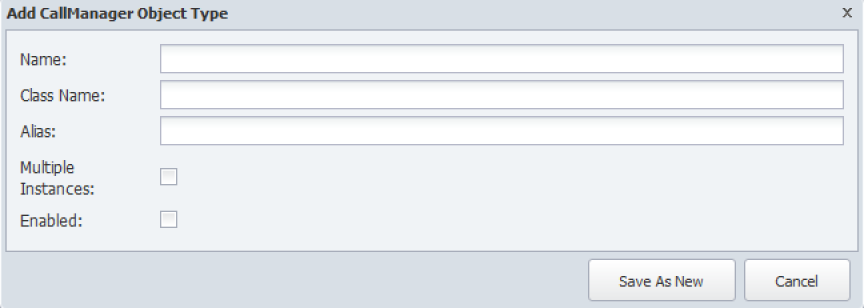
 next to an object type to display the Add/Edit CallManager Object Type pop-up.
 -
In the Name field, enter the object type name.
-
In the Class Name field, enter the class name.
-
In the Alias field enter the alias.
-
Select the Multiple Instances check box to enable the CallManager plugin to poll multiple instances of the object type.
-
Select the Enabled check box to enable the CallManager plugin to poll the object type indicators.
-
Click Save.
Manage CallManager Indicator Types
Indicator types determine what indicators are polled for an object type. The indicator types list displays the indicator types for the object type you select in the Object Types hierarchy. There are two types of indicator types.
-
Atomic indicator types are measured directly by the plugin.
-
Synthetic indicator types are indicators whose value is dependent upon other indicators; atomic and/or synthetic. Synthetic indicators enable you to combine the data from several indicators into one synthetic indicator so that SevOne NMS can properly evaluate indicators such as Percentage Loss, Percent Error, Percent Idle, and other high precision metrics.
Manage Atomic CallManager Indicator Types
Perform the following steps on the Object Types page to manage CallManager atomic indicator types.

-
Click on a CallManager object type in the hierarchy to display its indicator types on the right.
-
Click Add Atomic Indicator Type or click
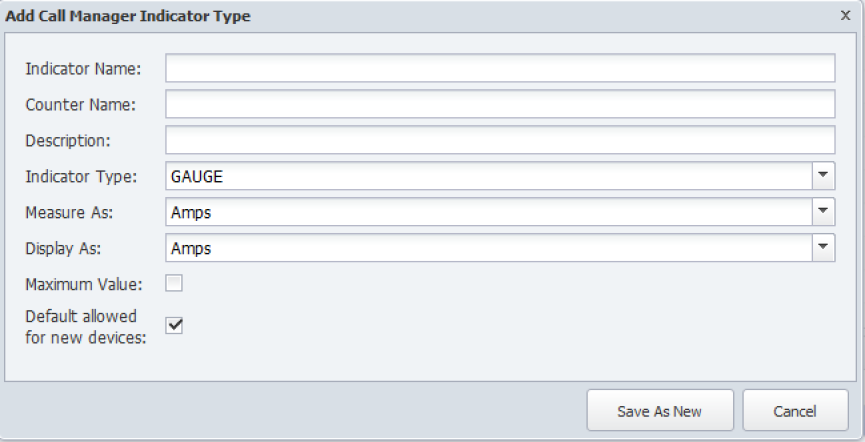
 to display the Add/Edit CallManager Indicator Type pop-up.
 -
In the Indicator Name field enter the name of the indicator type.
-
In the Counter Name field, enter the name of the counter.
-
In the Description field, enter the name to display.
-
Click the Indicator Type drop-down and select a type.
-
Click the Measured As drop-down and select a data unit.
-
Click the Display As drop-down and select a display unit.
-
Select the Maximum Value check box to indicate the indicator has a maximum value.
-
Select the Default Allowed for New Devices check box to have the CallManager plugin poll the indicator type by default when the object type is enabled and you enable the CallManager plugin for a device.
-
Click Save.
Manage CallManager Synthetic Indicator Types
Synthetic indicator types enable you to perform math on multiple metrics collected from multiple indicators on a single monitored object in order to calculate new KPIs.
This feature enables you create your own KPIs even when those KPIs do not exist on a device such as Percentage Loss, Percent Error, and Percent Idle. Synthetic indicators are always gauge type indicators and SevOne NMS evaluates all the indicator values the synthetic indicator uses as if the value is a gauge.
Example: You want to monitor voice gateways to reveal which PRI gets the most or least usage. Typical poll metrics enable you to report on the status of individual bearer channels and not the sum of all channels at any given time. This makes it difficult to monitor and alert on total PRI usage. Synthetic indicators enable you to sum the bearer channel statuses (each channel gets a value of 1 when busy), divide by the total number of bearer channels (23), and then multiply by 100, to collect the desired metric for PRI % usage.

-
Click on a CallManager object type in the hierarchy to display its indicator types on the right. If the object type does not have any indicator types, the Add Synthetic Indicator Type button does not appear.
-
Click Add Synthetic Indicator Type or click
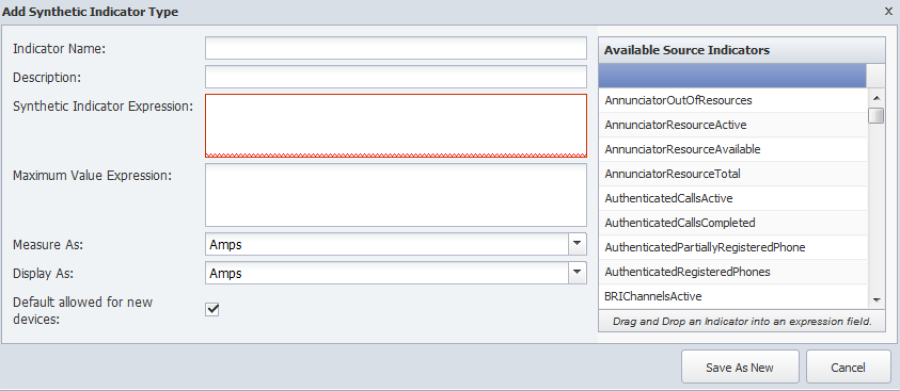
 next to a synthetic indicator type to display the Add/Edit Synthetic Indicator Type pop-up.
 -
In the Indicator Name field, enter the name of the synthetic indicator type.
-
In the Description field, enter the name to display.
-
The Synthetic Indicator Expression field enables you to define the calculation. If the border around the field turns red, your calculation is invalid and your graph results will be erroneous.
-
Click an indicator type in the Available Source Indicators field and drag it to the Synthetic Indicator Expression field. The Available Source Indicators field contains the indicator types associated to the object type you select in the hierarchy.
-
Enter applicable operators in the Synthetic Indicator Expression field to formulate the calculation. See the Acceptable Operators section below.
-
Drag additional source indicator types and enter additional mathematical symbols to create the expression in the Synthetic Indicator Expression field.
-
-
The Maximum Value Expression field enables you to define the indicator type maximum value calculation.
-
Click an indicator type in the Available Source Indicators field and drag it to the Maximum Value Expression field.
-
Enter applicable operators in the Maximum Value Expression field to formulate the calculation. See the Acceptable Operators section below.
-
Drag additional source indicator types and enter additional mathematical symbols to create the expression in the Maximum Value Expression field.
-
-
Click the Measure As drop-down and select a data unit.
-
Click the Display As drop-down and select a display unit.
-
Select the Default Allowed for New Devices check box to have the plugin poll the indicator type by default when the object type is enabled and you enable the plugin for a device.
-
Click Save.
Acceptable Operators
Your expression formula can include the following characters:
-
+ add
-
- subtract
-
* multiply
-
/ device
-
& & logical and
-
|| Logical or
-
<= less or equal
-
>= greater or equal
-
! not equal
-
== equal
-
> greater than
-
< less than
-
^ raise x to the power of y
-
% modulus
-
?: if then else
If your calculation results in either of the following invalid values, there will be a gap in your graph: Not a Number (NAN) and Infinity (+/-INF). The following is how SevOne NMS attempts to prevent invalid values. In sequence of processing:
-
Zero divided by zero results in NAN.
-
Any positive value divided by zero results in +INF.
-
Any negative value divided by zero results in -INF.
-
Zero multiplied by +/-INF results in NAN.
-
Any value added to, subtracted from, multiplied by, divided by, or divided from NAN results in NAN.
-
Any value compared to NAN (<, <=, ==, >=, >) results in 0. NAN != NAN.
-
Any value compared to +INF is less than +INF, except that +INF == +INF
-
Any value compared to -INF is greater than -INF, except that -INF == -INF
-
Any value added to or subtracted from +INF results in +INF
-
Any positive value multiplied by +/-INF results in +/-INF
-
Any value divided by +/-INF results in 0
Troubleshoot CallManager
Use the following check list to avoid common problems and to fine-tune your configuration.
-
Check the following if the AXL client application cannot connect to the AXL service.
-
Is the AXL application configured with the correct IP address for the AXL server?
-
Is the AXL application configured with the appropriate AXL user credentials?
-
Does the application server have HTTPS connectivity to the AXL server? Use the following URL to access AXL:
https://server-name:port/axl/ (port is 8443) -
Is HTTPS (secure) configured for AXL?
-
-
Perform the following steps to verify basic AXL functionality.
-
Go to the AXL API URL via a web browser.
Example: Enter https://servername:8443/axl/ in the Address field.
-
When prompted for user name and password, use the standard administrator login, or use the user name that is associated with a user group that is assigned the AXL role.
-
Look for a message that states the AXL listener is working and accepting requests but only communicates via POST.
-
-
If the AXL functions or requests fail with the User Authorization message: "Access to the requested resource has been denied" confirm that the user has the permission to the Standard AXL API Access. You can check this from the Permission Information section of the End User Configuration page.
-
If the AXL functions or requests fail, check the following:
-
AXL logs for AXL or SOAP error responses.
-
For further debugging, view the AXL log files with the RTMT application.
-
-
Your browser may not support display of this image. Check that applications in a cluster configuration are connected to the AXL service only on the Cisco Unified Communications Manager Publisher server if the application needs to modify the database.