
Table of Contents (Start)
SevOne NMS 5.4 Quick Start Guide - JMX
SevOne NMS Documentation
All SevOne NMS user documentation is available online from the SevOne Support website.
-
Enter email address and password.
-
Click Login.
-
Scroll down to the Solutions section.
© Copyright 2015, SevOne Inc. All rights reserved. SevOne, SevOne PAS, SevOne DNC, Deep Flow Inspection, and Rethink Performance are either registered trademarks or trademarks of SevOne Inc. Other brands, product, service and company names mentioned herein are for identification purposes only and may be trademarks of their respective owners.
Introduction
This document describes the best practices for SevOne NMS users to implement and manage the polling of Java Management Extensions (JMX) data from your network.
JMX is a Java specification technology (defined in JSR-160) that provides a standard means for Java applications to publish indicators to JMX compliant management and monitoring systems. JMX technology is a part of the Java Platform, Standard Edition (Java SE platform). JMX technology provides a standard way to manage resources such as applications, devices, and services. You can use JMX to monitor and manage resources as they are created, installed, and implemented. You can also use JMX to monitor and manage the Java Virtual Machine (Java VM).
JMX technology measures and controls a given resource by one or more Java objects known as Managed Beans (MBeans). MBeans are registered in the MBean server which acts as a management agent and can run on devices that are enabled for the Java programming language. The specifications define JMX agents you use to manage resources that are configured for management. A JMX agent consists of an MBean server, in which MBeans are registered, and a set of services for handling the MBeans. In this way, JMX agents directly control resources and make them available to remote management applications like SevOne NMS.
In SevOne NMS, plugins are mechanisms that poll (collect, ask for, etc.) data from technologies. Plugins define a way to get data, usually via some protocol such as SNMP, ICMP, WMI, etc. Many plugins are automatically enabled when you add a device to SevOne NMS so you can poll applicable objects with minimal configuration. JMX requires device specific input.
Objects are discrete components of a device or a software component that have one or more performance indicators on which SevOne NMS can monitor, trend, and alert. SevOne NMS considers an element to be any performance object. Indicators are grouped by indicator types which in turn are grouped by object types.
-
Object Types - Define logical things to ask for information about.
-
Indicator Types - Define kinds of metrics that object types can have.
The JMX plugin detects and monitors the JMX indicators for the object types that you enable to be polled. When you enable the JMX plugin, SevOne NMS discovers the device and any objects for the JMX object types and the indicators for the JMX indicator types you enable from the Object Types page.
Enable Devices to Send JMX Data to SevOne NMS
This chapter describes how to enable devices to send JMX data to SevOne NMS. This workflow is outside of the SevOne NMS application and may not present all of the steps your network requires to enable devices to send JMX data. If these instructions are not applicable for your network please reference the device manufacturer's documentation.
Send JMX Data to SevOne NMS
Enter the following command on the JMX device.
Hostname –i
The result should not equal 127.0.0.1
Tomcat
Enter the following commands for the Tomcat Startup script.
JAVA_OPTS="$JAVA_OPTS -Dcom.sun.management.jmxremote"
JAVA_OPTS="$JAVA_OPTS -Dcom.sun.management.jmxremote.port=8007"
JAVA_OPTS="$JAVA_OPTS -Dcom.sun.management.jmxremote.authenticate=false"
JAVA_OPTS="$JAVA_OPTS -Dcom.sun.management.jmxremote.ssl=false"
JAVA_OPTS="$JAVA_OPTS -Djava.rmi.server.hostname=192.168.50.213"
WebLogic
Enter the following commands for the WebLogic Startup script.
/opt/Oracle/Middleware/wlserver_10.3/samples/domains/wl_server/bin/startWebLogic.sh
JAVA_OPTIONS="$JAVA_OPTIONS -Dcom.sun.management.jmxremote"
JAVA_OPTIONS="$JAVA_OPTIONS -Dcom.sun.management.jmxremote.port=8007"
JAVA_OPTIONS="$JAVA_OPTIONS -Dcom.sun.management.jmxremote.authenticate=false"
JAVA_OPTIONS="$JAVA_OPTIONS -Dcom.sun.management.jmxremote.ssl=false"
JAVA_OPTIONS="$JAVA_OPTIONS -Djava.rmi.server.hostname=192.168.30.251"
JAVA_OPTIONS="$JAVA_OPTIONS -Djavax.management.builder.initial=weblogic.management.jmx.mbeanserver.WLSMBeanServerBuilder"
You must also enable this on the Administrative page.
domain -> Configuration -> general (Advanced) , usePlatformMBean , exportPlatformMBean
JBoss
Enter the following commands to enable JBoss to send JMX data. Change the hostname and IP to /etc/hosts to connect. The servername cannot be listed under 127.0.0.1.
In /opt/jboss/bin/run.sh add #Setup jmx remoting
JAVA_OPTS="$JAVA_OPTS -Dcom.sun.management.jmxremote.authenticate=false"
JAVA_OPTS="$JAVA_OPTS -Dcom.sun.management.jmxremote.ssl=false"
JAVA_OPTS="$JAVA_OPTS -Dcom.sun.management.jmxremote.port=8007"
Use the JBoss MBeanServerBuilder.
JAVA_OPTS="$JAVA_OPTS -Djboss.platform.mbeanserver"
JAVA_OPTS="$JAVA_OPTS -Djavax.management.builder.initial=org.jboss.system.server.jmx.MBeanServerBuilderImpl"
Use the jboss logmanager.
JAVA_OPTS="$JAVA_OPTS -Djava.util.logging.manager=org.jboss.logmanager.LogManager"
JAVA_OPTS="$JAVA_OPTS -Dorg.jboss.logging.Logger.pluginClass=org.jboss.logging.logmanager.LoggerPluginImpl"
JBOSS_CLASSPATH="../lib/jboss-logmanager.jar"
GlassFish
Increase the monitoring to HIGH on the Web Admin page and enter the following commands to enable GlassFish v 3.1 to send JMX data.
In the domain configuration file /glassfish/domains/domain1/config/domain.xml find <java-config> and add:
-Dcom.sun.management.jmxremote.ssl=false
-Dcom.sun.management.jmxremote.authenticate=false
Then find <admin-service> and add/modify:
<jmx-connector accept-all="true" port="8007" address="0.0.0.0" security-enabled="false" name="system" auth-realm-name="admin-realm" />
WebSphere 6.1
Enter the following commands for WebSphere 6.1.
Install the server.
{ yum install compat-libstdc++-* libXp libXmu }
Run the server.
{ /etc/init.d/webspherejmxserverNode01_was.init start }
Log in via the admin console and make sure the JMX RMI connection is established.
Use the Python script ListPorts to get the admin port.
{ ./wsadmin.sh -conntype none -lang jython -profileName AppSrv01 -f /opt/ListPorts.py }
Log into the server.
{ admin:admin }
Back to the CLI, disable security.
{
./wsadmin.sh -conntype NONE
wsadmin>securityoff
wsadmin>$AdminConfig save
}
Connect with the following script.
#!/bin/bash
HOST=
PORT=
WAS_HOME=/home/dkozlowski/IBM/WebSphere/AppServer
CLIENTSAS="-Dcom.ibm.CORBA.ConfigURL=file:`pwd`/sas.client.props"
PROVIDER="-Djava.naming.provider.url=corbaname:iiop:$HOST:$PORT"
PROPS=
#PROPS="$PROPS $CLIENTSAS"
#PROPS="$PROPS $PROVIDER"
CLASSPATH=
CLASSPATH="$CLASSPATH:$WAS_HOME/java/lib/tools.jar"
CLASSPATH="$CLASSPATH:$WAS_HOME/runtimes/com.ibm.ws.admin.client_7.0.0.jar"
CLASSPATH="$CLASSPATH:$WAS_HOME/runtimes/com.ibm.ws.ejb.thinclient_7.0.0.jar"
CLASSPATH="$CLASSPATH:$WAS_HOME/runtimes/com.ibm.ws.orb_7.0.0.jar"
CLASSPATH="$CLASSPATH:$WAS_HOME/java/lib/jconsole.jar"
URL=service:jmx:iiop://$HOST:$PORT/jndi/JMXConnector
java -classpath $CLASSPATH $PROPS sun.tools.jconsole.JConsole $URL
WebSphere 8.5
WebSphere JMX Configuration
-
Log on to the WebSphere Admin Console.
-
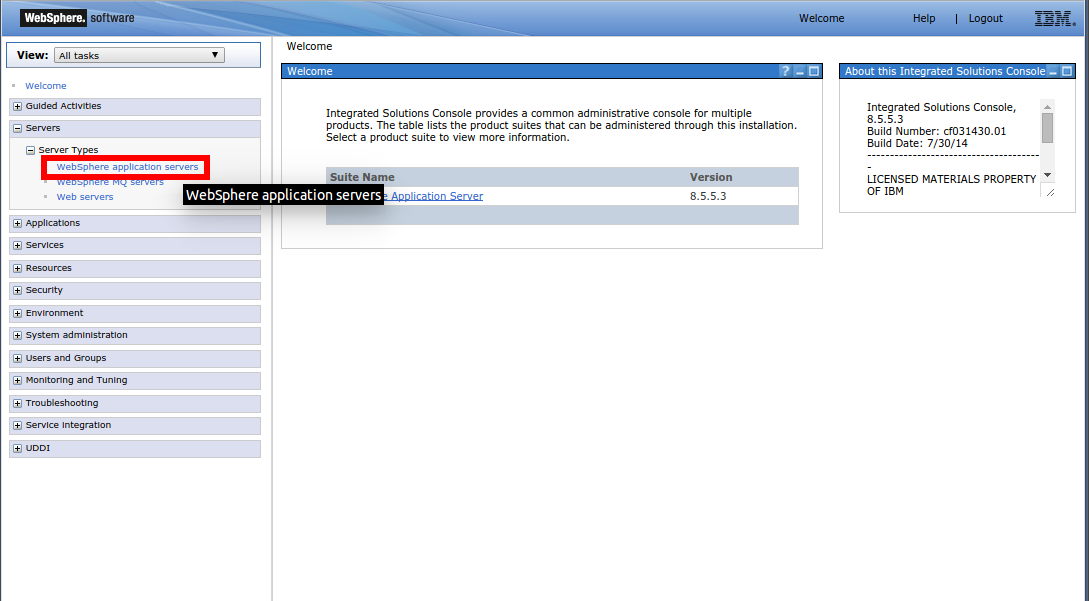
Click Servers on the left to expand the Servers options.
-
Click Server Types to display the Server Types options.
-
Click the WebSphere Application Servers link to display the application servers on the right.
-
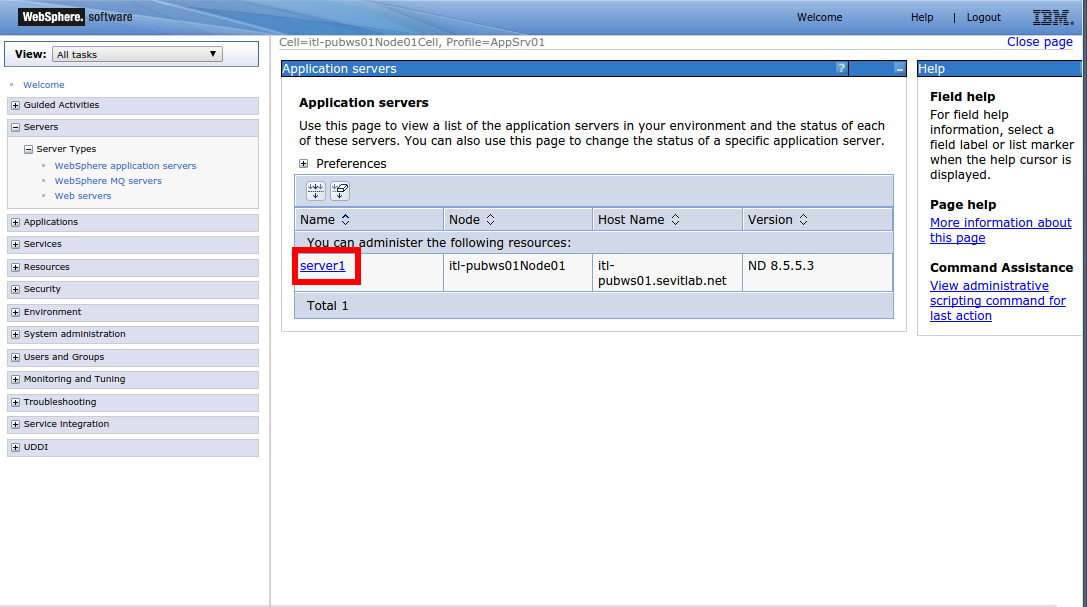
Click on the server to administer.
-
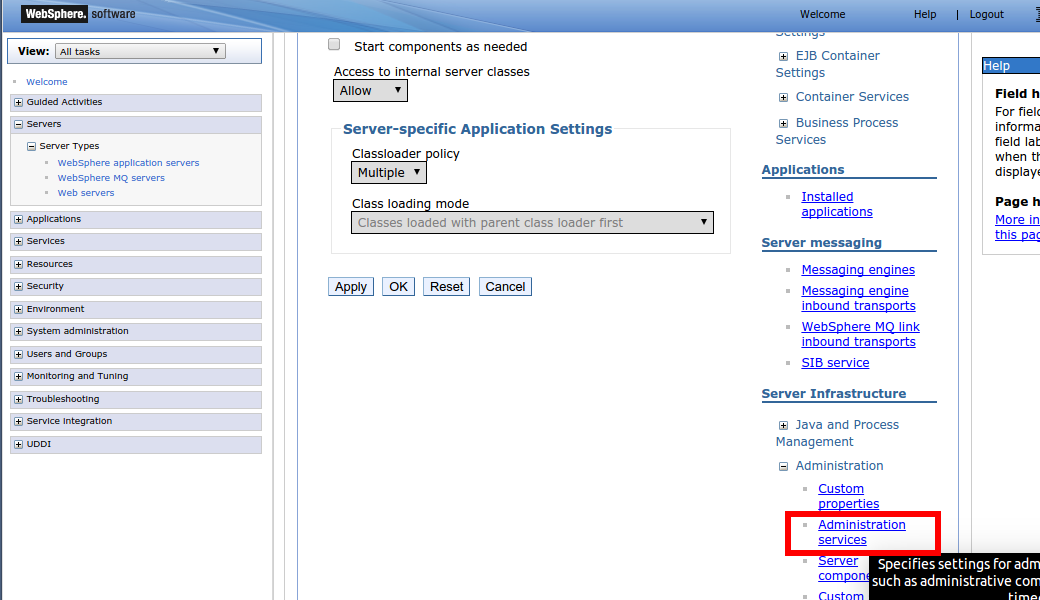
On the right in the Server Infrastructure section, click Administration Services to display the Administration Services options.
-
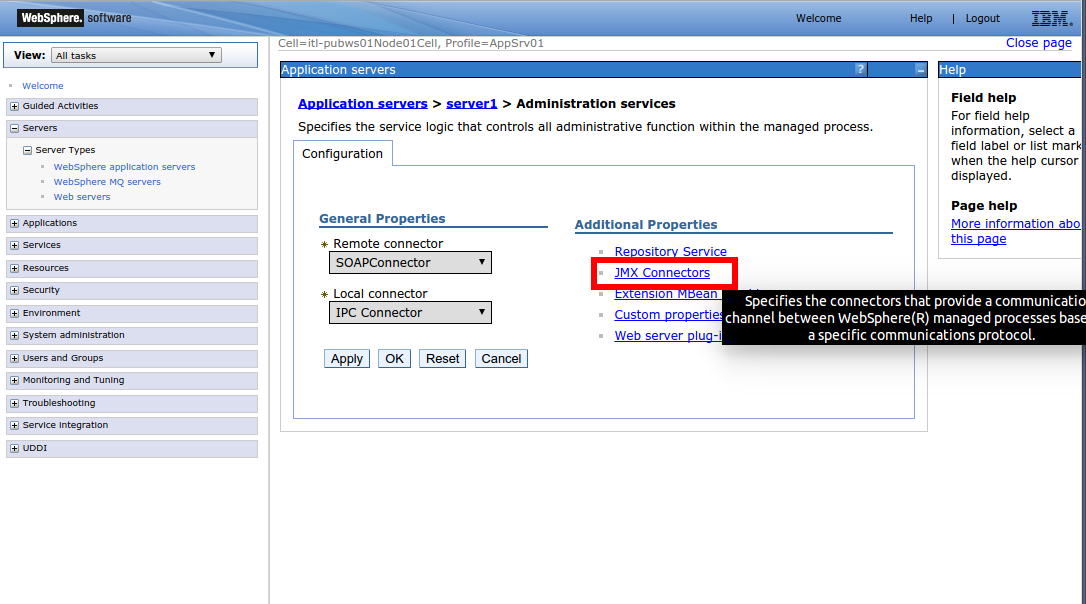
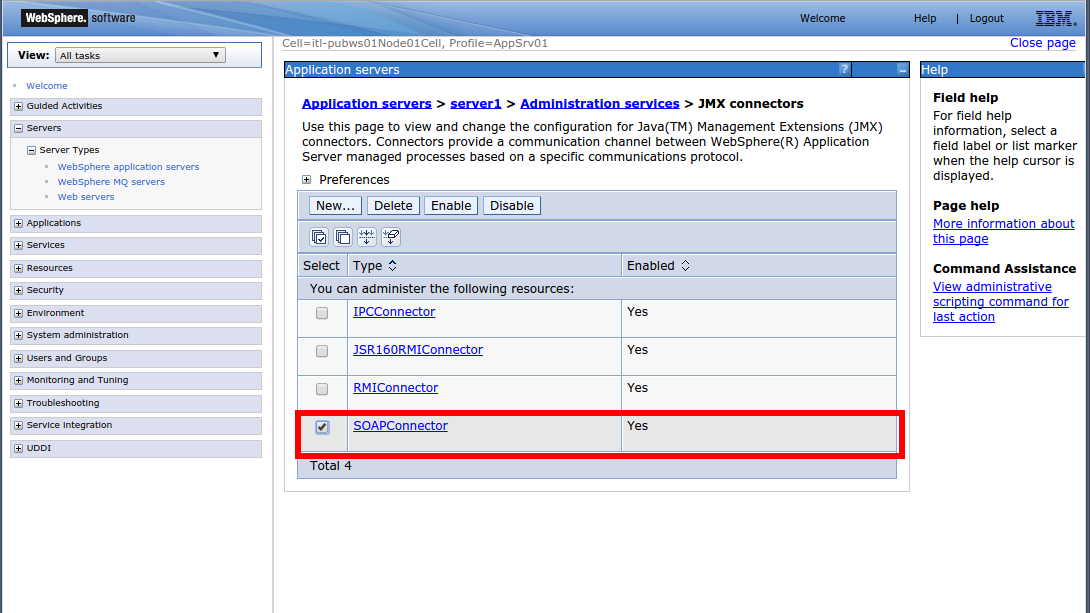
In the Additional Properties section, click JMX Connectors.
-
Select the SOAPConnector check box, if needed.
-
Return to the previous page.
-
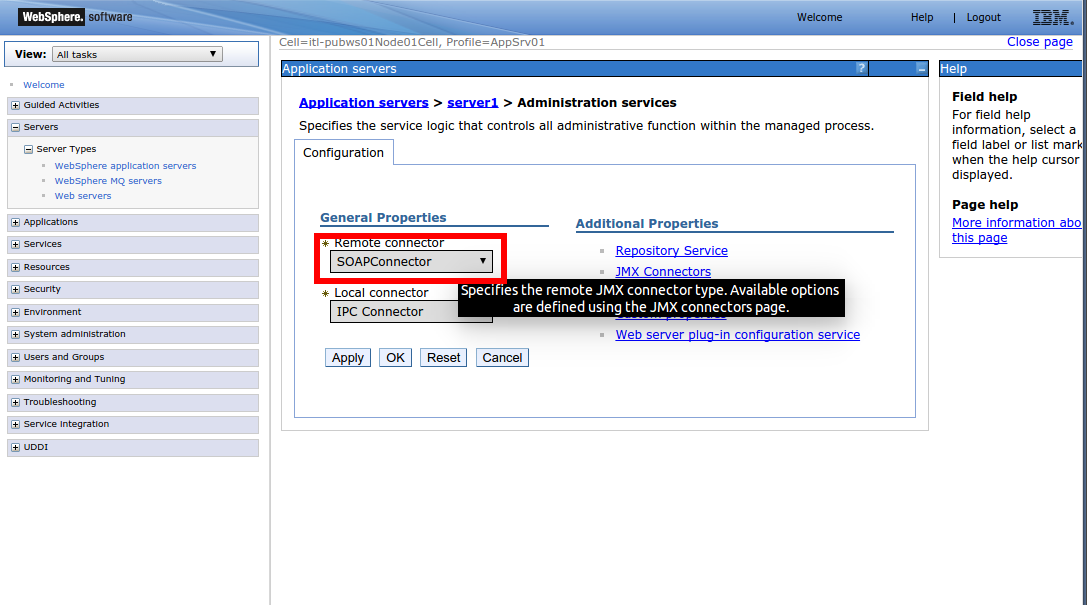
In the General Properties section, click the Remote Connector drop-down and select SOAPConnector.
-
Click Apply.
-
Return to the Servers page to find the port for SevOne NMS to use to monitor the device.
-
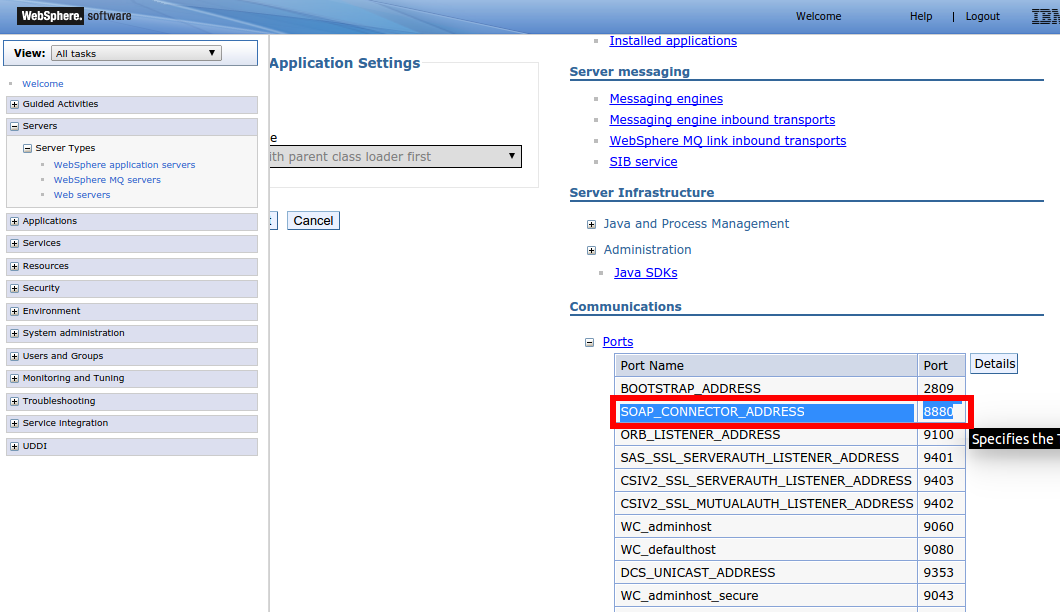
In the Communications section, click Ports to expand the Ports list.
-
Make a note of the SOAP_CONNECTOR_ADDRESS port number. This port number is used for the device on the Edit Device page.
Enable JMX Plugin
The JMX plugin requires device specific configuration and is therefore disabled on new devices by default. The Device Manager provides access to the Edit Device page where you enable and configure the JMX plugin for each device.
Perform the following steps to enable the JMX plugin for each device from which to discover JMX objects and to poll JMX metrics.
-
From the navigation bar, click Devices and select Device Manager to display the Device Manager
-
Click
 next to a device to display the Edit Device page.
 -
In the plugin section (displays SNMP by default), click the drop-down and select JMX.
-
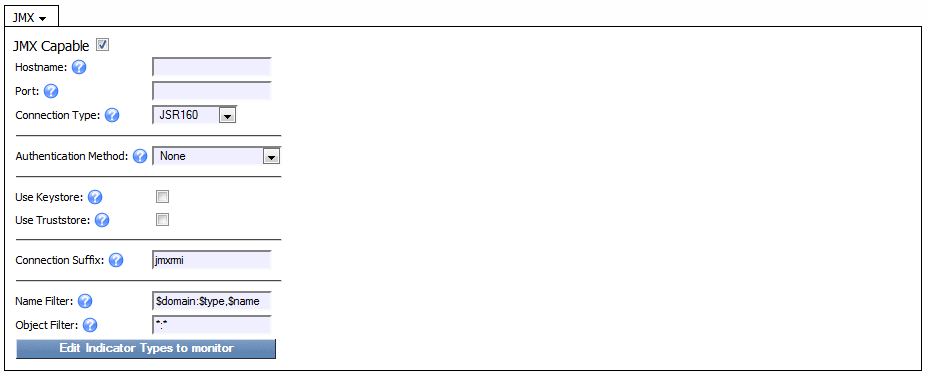
Select the JMX Capable check box to enable discovery of the JMX object types you enable and to poll JMX data on the device.
-
In the Hostname field, enter the JMX server host name.
-
In the Port field, enter the port number on the JMX server for SevOne NMS to use.
-
Click the Connection Type drop-down.
-
Select JSR160 to use to connect to the server using JSR160 over the REST based protocol.
-
Select AdminClient to use the Websphere Network Deployable AdminClient protocol.
-
-
Click the Authentication Method drop-down.
-
Select None to have SevOne NMS not use an authentication method to access the device.
-
Select Username/Password to have SevOne NMS use a user name and password to access the device. Additional fields appear to enable you to enter the user name and password SevOne NMS needs to authenticate onto the device.
-
-
If you use WebSphere v8.5, select the Use Keystore check box and perform the following steps to select the Keystore and to enter the SSL credentials that enable you to use the JMX Keystore feature. Leave clear if you do not use WebSphere v8.5.
-
Click Upload Keystore to display the Import Keystore pop-up.
-
Click
 to navigate your file system hierarchy and select the Keystore.
 -
In the Keystore Password field, enter the password SevOne NMS needs to authenticate onto the device.
-
-
If you use WebSphere v8.5, select the Use Truststore check box and perform the following steps to select the Truststore and to enter the SSL credentials that enable you to use the JMX Truststore feature. Leave clear if you do not use WebSphere v8.5.
-
Click Upload Truststore to display the Import Truststore pop-up.
-
Click
 to navigate your file system hierarchy and select the Truststore.
 -
In the Truststore Password field, enter the password SevOne NMS needs to authenticate onto the device.
-
-
In the Connection Suffix field, enter the JMX server suffix SevOne NMS needs to gain access the JMX server. This is set to jmxrmi by default and should not be changed.
-
In the Name Filter field, enter the name of the filter to use to generate the names for the JMX objects.
-
In the Object Filter field, enter the filters to use to limit the discovery of JMX objects. To separate filters use the ; character.
-
On the New Device page, click Save as New to display the Edit Device page to perform the next step.
-
Click Edit Indicator Types to Monitor to display the Indicator Type Map page where you select to enable or disable the JMX indicator types to poll on the device. Note the legend/explanation for the indicators.
-
Bold - The SNMP plugin polls the indicator by default when discovered on a device.
-
Italic - The indicator's object type is enabled from the Object Type Manager.
-
Normal - The indicator's object type is disabled and the indicator is not being polled.
-
-
Select the check box for each individual indicator to poll the indicators you select for the device.
Manage JMX Object Types and Indicator Types
The JMX plugin discovers the JMX object types on the devices you enable to send JMX data to SevOne NMS. JMX object types are disabled by default. The Object Rules page enables you to define rules to disable polling of objects and the Object Manager enables you to manage the objects on each device. The Object Types page enables you to manage JMX object types and indicator types.
To access the Object Types page from the navigation bar, click the Administration menu, select Monitoring Configuration, and then select Object Types.
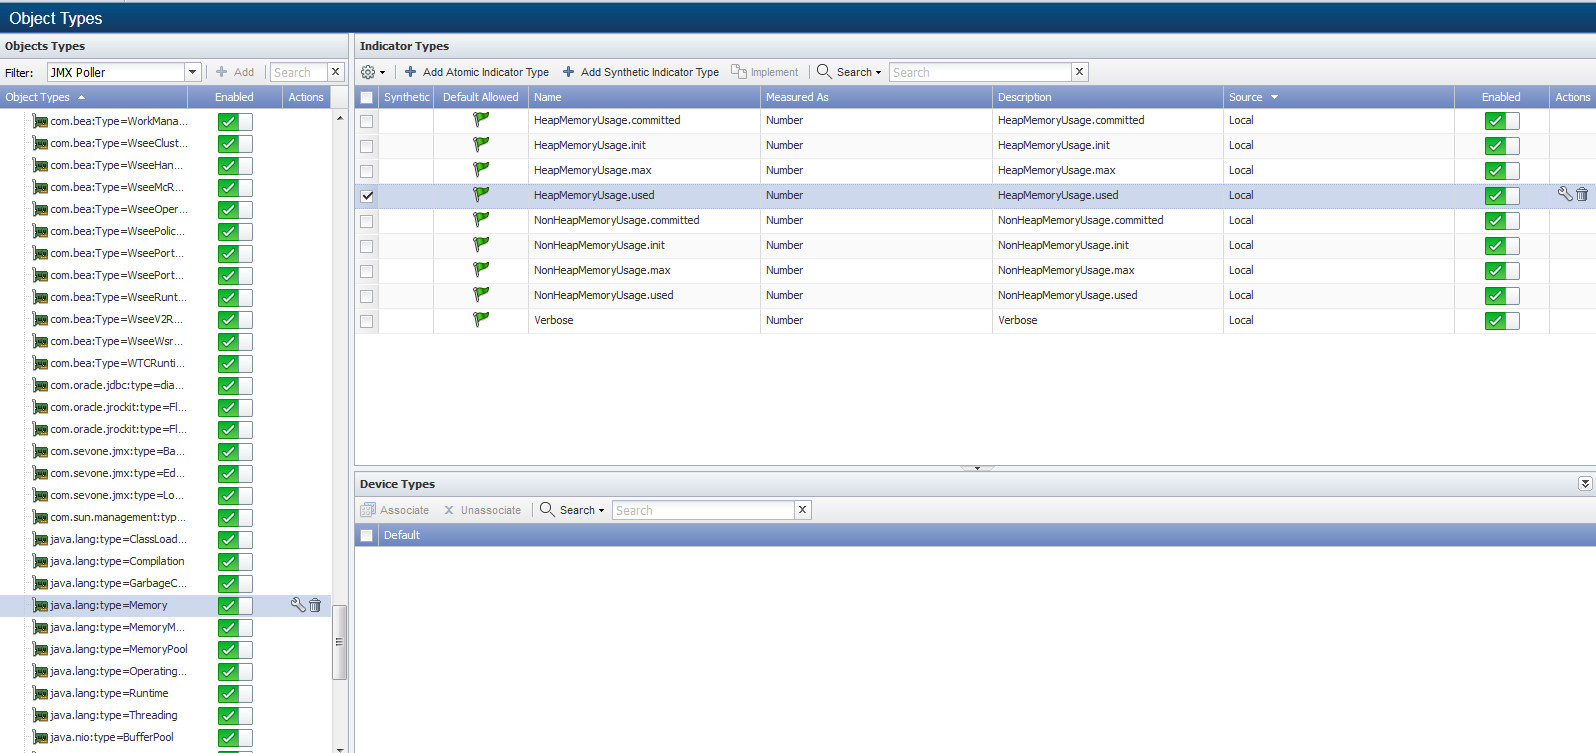
Click the Filter drop-down and select JMX Poller to display the object types the JMX plugin can poll in the Object Types hierarchy on the left.
Manage JMX Object Types
Perform the following steps to manage JMX object types.
-
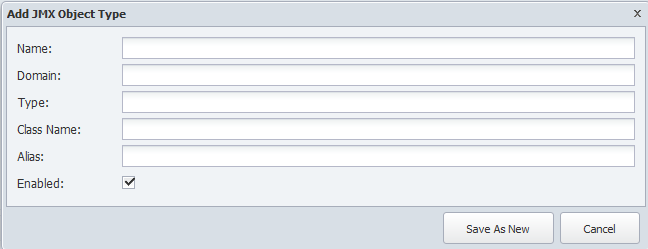
Above the Object Type hierarchy, click Add or click
 next to an object type to display the Add/Edit JMX Object Type pop-up.
 -
In the Name field, enter the name of the object type.
-
In the Domain field, enter the domain of the object type.
-
In the Type field enter the type of the object type.
-
In the Class Name field, enter the class name of the object type.
-
In the Alias field enter the alias of the object type.
-
Select the Enabled check box to enable the JMX plugin to poll the object type.
-
Click Save.
Manage JMX Indicator Types
Indicator types determine what indicators are polled for an object type. The indicator types list displays the indicator types for the object type you select in the Object Types hierarchy. There are two types of indicator types.
-
Atomic indicator types are measured directly by the plugin.
-
Synthetic indicator types are indicators whose value is dependent upon other indicators; atomic and/or synthetic. Synthetic indicators enable you to combine the data from several indicators into one synthetic indicator so that SevOne NMS can properly evaluate indicators such as Percentage Loss, Percent Error, Percent Idle, and other high precision metrics.
Manage JMX Atomic Indicator Types
Perform the following steps on the Object Types page to manage JMX atomic indicator types.
-
Click on a JMX object type in the hierarchy to display its indicator types on the right.
-
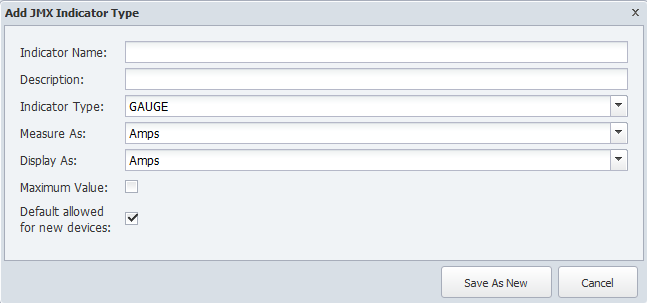
Click Add Atomic Indicator Type or click
 to display the Add/Edit JMX Indicator Type pop-up.
 -
In the Indicator Name field enter the name of the indicator type.
-
In the Counter Name field, enter the name of the counter.
-
In the Description field, enter the name to display.
-
Click the Indicator Type drop-down and select a type.
-
Click the Measured As drop-down and select a data unit.
-
Click the Display As drop-down and select a display unit.
-
Select the Maximum Value check box to indicate the indicator has a maximum value.
-
Select the Default Allowed for New Devices check box to have the JMX plugin poll the indicator type by default when the object type is enabled and you enable the JMX plugin for a device.
-
Click Save.
Manage JMX Synthetic Indicator Types
Synthetic indicator types enable you to perform math on multiple metrics collected from multiple indicators on a single monitored object in order to calculate new KPIs.
This feature enables you create your own KPIs even when those KPIs do not exist on a device such as Percentage Loss, Percent Error, and Percent Idle. Synthetic indicators are always gauge type indicators and SevOne NMS evaluates all the indicator values the synthetic indicator uses as if the value is a gauge.
Example: You want to monitor voice gateways to reveal which PRI gets the most or least usage. Typical poll metrics enable you to report on the status of individual bearer channels and not the sum of all channels at any given time. This makes it difficult to monitor and alert on total PRI usage. Synthetic indicators enable you to sum the bearer channel statuses (each channel gets a value of 1 when busy), divide by the total number of bearer channels (23), and then multiply by 100, to collect the desired metric for PRI % usage.
-
Click on a JMX object type to display its indicator types on the right. If the object type does not have any indicator types, the Add Synthetic Indicator Type button does not appear.
-
Click Add Synthetic Indicator Type or click
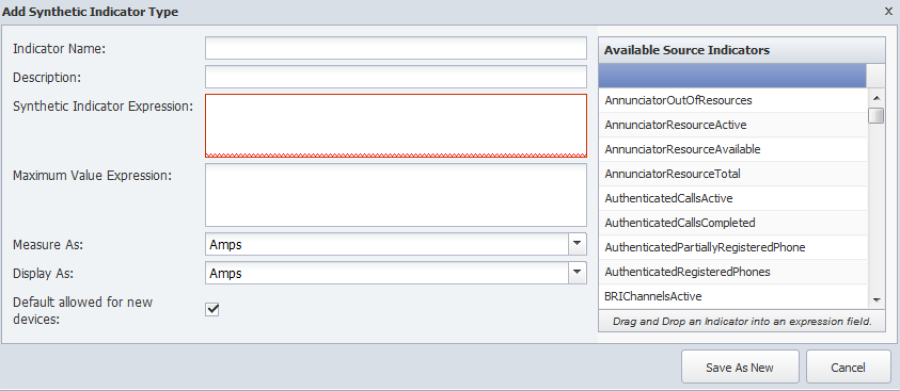
 next to a synthetic indicator type to display the Add/Edit Synthetic Indicator Type pop-up.
 -
In the Indicator Name field, enter the name of the synthetic indicator type.
-
In the Description field, enter the name to display.
-
The Synthetic Indicator Expression field enables you to define the calculation. If the border around the field turns red, your calculation is invalid and your graph results will be erroneous.
-
Click an indicator type in the Available Source Indicators field and drag it to the Synthetic Indicator Expression field. The Available Source Indicators field contains the indicator types associated to the object type you select in the hierarchy.
-
Enter applicable operators in the Synthetic Indicator Expression field to formulate the calculation. See the Acceptable Operators section below.
-
Drag additional source indicator types and enter additional mathematical symbols to create the expression in the Synthetic Indicator Expression field.
-
-
The Maximum Value Expression field enables you to define the indicator type maximum value calculation.
-
Click an indicator type in the Available Source Indicators field and drag it to the Maximum Value Expression field.
-
Enter applicable operators in the Maximum Value Expression field to formulate the calculation. See the Acceptable Operators section below.
-
Drag additional source indicator types and enter additional mathematical symbols to create the expression in the Maximum Value Expression field.
-
-
Click the Measure As drop-down and select a data unit.
-
Click the Display As drop-down and select a display unit.
-
Select the Default Allowed for New Devices check box to have the plugin poll the indicator type by default when the object type is enabled and you enable the plugin for a device.
-
Click Save.
Acceptable Operators
Your expression formula can include the following characters:
-
+ add
-
- subtract
-
* multiply
-
/ device
-
& & logical and
-
|| Logical or
-
<= less or equal
-
>= greater or equal
-
! not equal
-
== equal
-
> greater than
-
< less than
-
^ raise x to the power of y
-
% modulus
-
?: if then else
If your calculation results in either of the following invalid values, there will be a gap in your graph: Not a Number (NAN) and Infinity (+/-INF). The following is how SevOne NMS attempts to prevent invalid values. In sequence of processing:
-
Zero divided by zero results in NAN.
-
Any positive value divided by zero results in +INF.
-
Any negative value divided by zero results in -INF.
-
Zero multiplied by +/-INF results in NAN.
-
Any value added to, subtracted from, multiplied by, divided by, or divided from NAN results in NAN.
-
Any value compared to NAN (<, <=, ==, >=, >) results in 0. NAN != NAN.
-
Any value compared to +INF is less than +INF, except that +INF == +INF
-
Any value compared to -INF is greater than -INF, except that -INF == -INF
-
Any value added to or subtracted from +INF results in +INF
-
Any positive value multiplied by +/-INF results in +/-INF