
Table of Contents (Start)
SevOne NMS 5.4 Quick Start Guide - Self-monitoring
Introduction
At SevOne, we're crazy about performance monitoring. If it's connected to a network, SevOne NMS will monitor it. Whatever it is–router, server, switch, telephone system–we say monitor that bad boy! We think monitoring is so important that we'd like to talk about monitoring the things that do the monitoring.
Self-monitoring involves monitoring SevOne appliances through SevOne NMS, just as you would any of your other devices. Monitoring your appliances helps you detect potential problems and address them immediately. It's also really useful for existing problems, especially when you don't know the source. Sometimes it's not immediately clear what kind of problem you're dealing with. Maybe it's a hardware issue. Maybe it's software. Or maybe it's at the network level. With self-monitoring, you can pinpoint the cause and resolve problems quickly, preventing downtime.
In the next sections, we'll cover the following:
-
Things to monitor
-
Best practices
-
Setting up appliances for self-monitoring
-
Self-monitoring activities
-
Recommended policies
-
Self-monitoring objects and indicators
Prerequisites
As part of the process, you'll need to SSH into your SevOne appliance as the root user. Make sure to have the following ready:
-
An SSH client, such as PuTTY
-
IP address of the SevOne appliance
-
Root access to the appliance
-
The self-monitoring install script. Please contact SevOne Support to make sure that you have the most current version of the install script, install.sh. The install script, which ships with your appliance, is located in /usr/local/scripts/utilities/plugins/selfmon.
What to Monitor
In this section, we'll talk about which components to pay attention to. We'll also be looking at ideal ranges, signs of trouble, and some of the available indicators.
CPU
When it comes to the CPU, we want to focus on the total aggregate CPU usage. Looking at the sum of the CPU cores rather than at individual cores provides an overview of the CPU activity. If there's a problem with the total aggregate usage, it may be a good idea to start looking at individual cores to determine whether it's just specific cores or all cores that are acting up. This can help us pinpoint whether the problem is related to a particular process or to the entire system.
Ideally, CPU usage will be in the following ranges:
-
Idle time >= 50% - most of the time, the CPU shouldn't be doing a whole lot.
-
Waiting time <= 10% - if the waiting time is consistently 10% or higher, the system is doing a little too much waiting, and we need to find out why.
Disk
When looking at disks, our two main areas of focus are free disk space and input/output (I/O). The typical SevOne appliance has three main disk components:
-
sda
-
/ - contains the entire operating system, including libraries, executables, etc.
-
/index - is used by the database for indexing activities. This lets us distribute our read/write requests across another disk to improve performance.
-
-
sdb
-
/data - contains large amounts of data (covering long time spans), flow data, etc.
-
-
fioa
-
/ioDrive - optional Fusion-io SSD, included with higher-capacity appliances.
-
The following are the ideal amounts of free disk space:
-
/, /ioDrive >= 20% free
-
/data >= 10% free - if this is too full, the database can freeze up.
SNMP reports I/O statistics for entire disks as well as the individual partitions of each disk. For self-monitoring purposes, we're interested in the entire disk. The following are three I/O states and information about what they mean:
-
I/O is low - this means there's not a whole lot going on at the moment. Generally speaking, there's nothing to worry about here.
-
I/O is up and down - this means that there's some reading and writing going on. This isn't cause for concern–just work as usual.
-
I/O is high - if it's consistently high, this means that the disk is constantly reading and writing. This is a red flag and requires a closer look.
One possible cause of high I/O is hot standby synchronization, which involves copying lots of data from one appliance to another. However, it's always good to check into the exact cause of high I/O.
RAID
It's important to keep an eye on RAID behavior. By monitoring RAID, you can get information about potential disk failure before it happens. You can then take appropriate action to ensure that the performance is minimally affected or not affected at all.
You'll want to keep an eye on the following things:
-
RAID array state. This applies to the array. The RAID array state should be 4. Anything other than 4 is cause for concern.
-
RAID disk predictive failure count. This applies to the individual disks that make up the array. Predictive failures result from trends of certain errors and act as warning signs, indicating that you may need to replace the disk.
-
RAID disk firmware state. This also applies to individual disks. The firmware state should be 7. If it's not 7 on any of the disks, then there may be a problem with that disk.
Memory
There are a couple of things to keep in mind about memory as it applies to SevOne appliances. First, you'll notice pretty high memory usage. Depending on how much RAM an appliance has, it might be close to 100%. Memory usage on appliances with a greater amount of RAM may not be quite so close to the 100% mark, but it'll still be high. This is because the Linux kernel caches all kinds of stuff in RAM. For example, if you write to a file, as long as there's free space in RAM, the kernel will take the whole file and dump it in RAM. So, when you read and write to the file, you're reading and writing to memory, which makes the process nice and fast! The kernel then caches the file to disk.
Next, there's the issue of swap. From some perspectives, swap is great. However, swap isn't such a good thing from our current perspective. SevOne appliances ship with a ton of memory–so much, in fact, that there shouldn't be any need for swap. Swapping should almost never occur. It should only occur when absolutely necessary, and that shouldn't be often. If there is anything in swap, it shouldn't be over 1 GB. Long story short, if we're using swap, it means that we've used up a whole lot of memory. Now we need to find out why.
Possible causes of swap include:
-
Memory leak
-
A poorly designed script
Used Memory
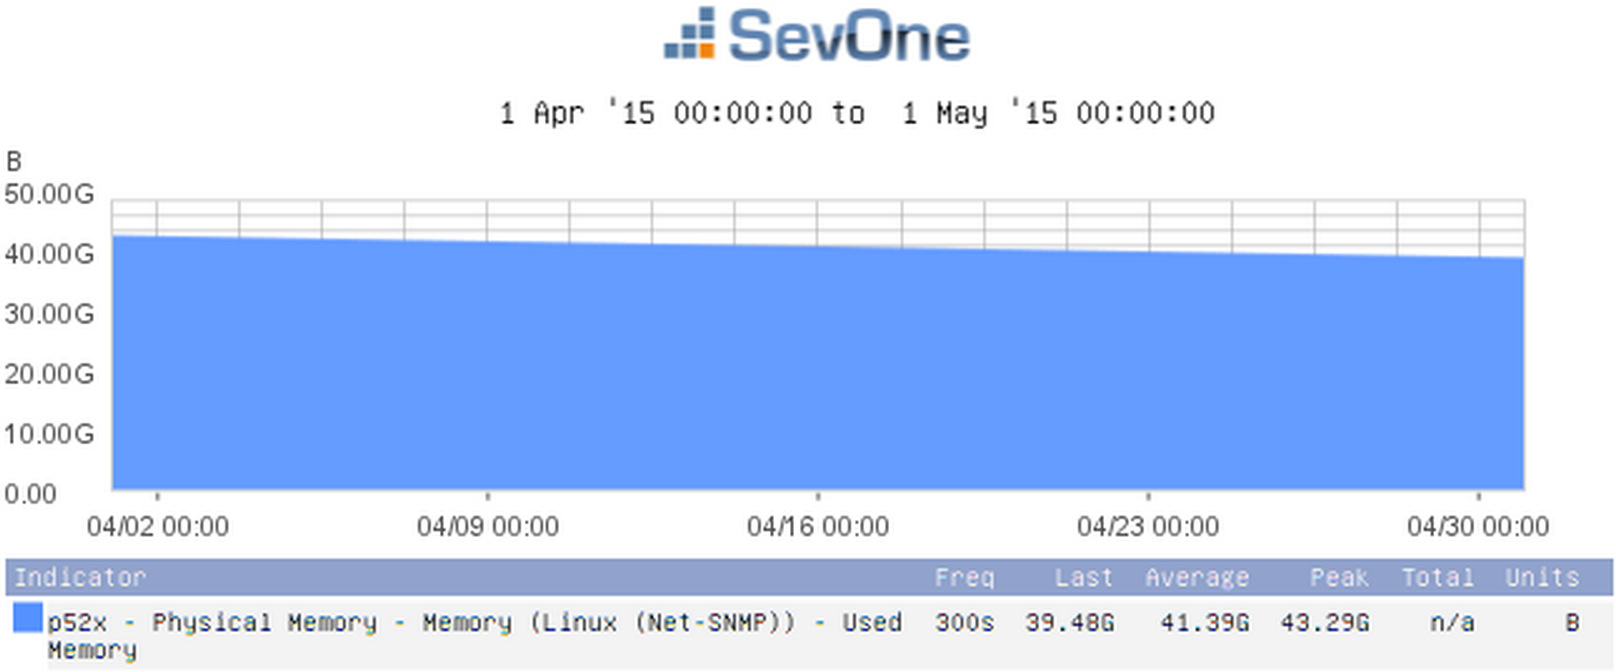
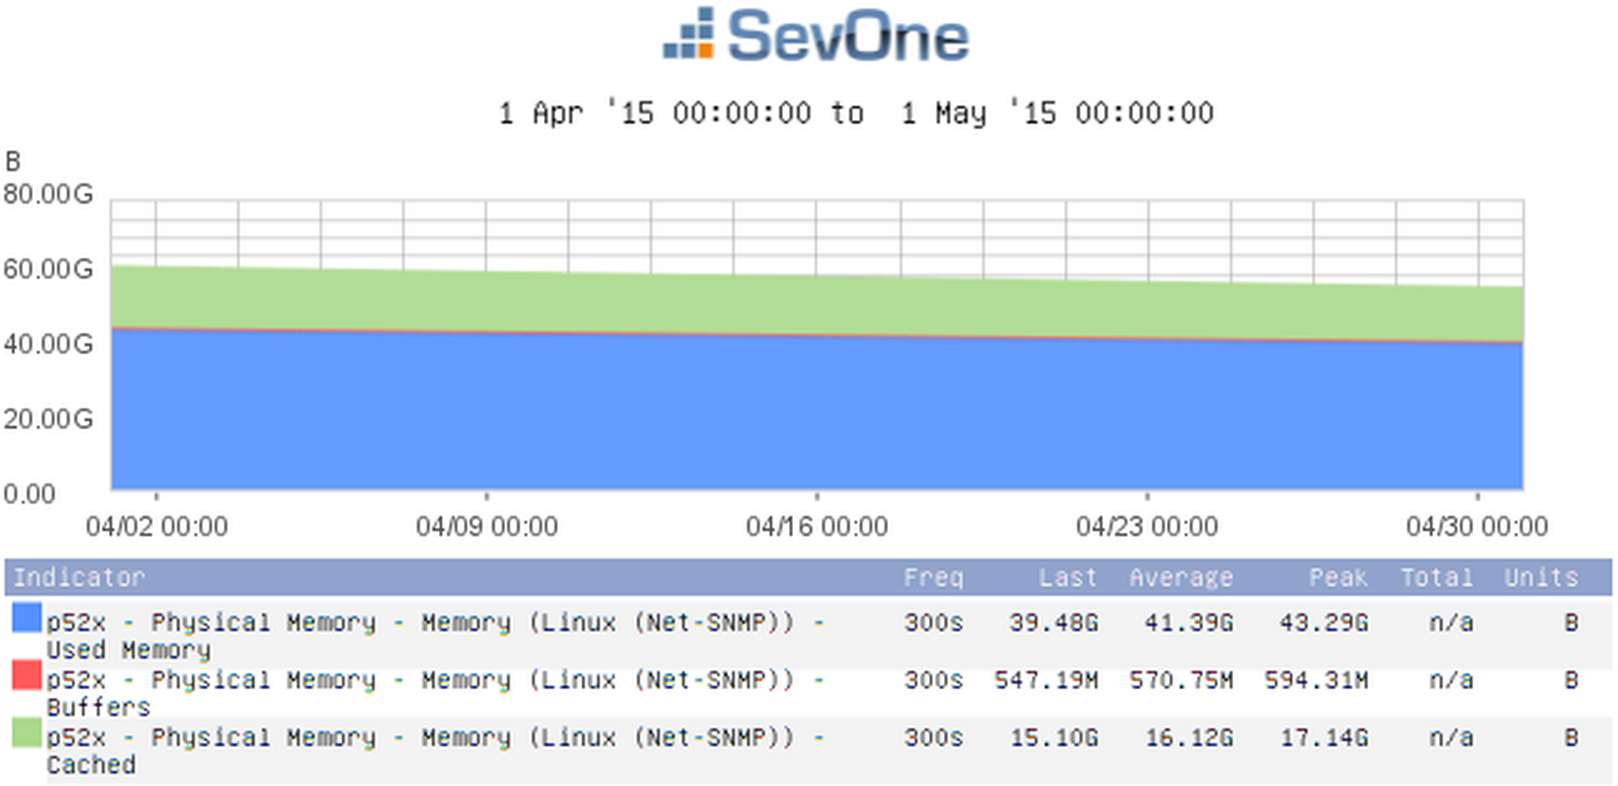
You can use SNMP stats to look at the amount of used memory, among other things. One of the indicators you'll use is Used Memory. But you'll also want to include the Cached indicator and the Buffers indicator. This will give you a more accurate picture of the memory being used, because some of that memory may be cached. Compare the two screenshots below. The first one shows only the results for used memory. In the second one, you can see that same amount of used memory, but you'll also see how much memory is cached.
Processes
Make sure to monitor all SevOne processes–everything with SevOne as part of its name. Below is information on process monitoring using the Process Poller and SNMP.
Process Poller
The Process Poller provides stats for processes related to the following:
-
Apache
-
Bash
-
CRON scheduler
-
MySQL
-
PHP
-
etc.
Refer to the Process Poller monitoring information in SevOne NMS for a list of processes that are identified and monitored for the following information:
-
Availability
-
CPU Time
-
Instances of the process
-
System memory used - this refers to actual memory and doesn't include virtual.
SNMP
All major SevOne NMS processes connect to the database and issue queries. Every SevOne daemon exports SNMP information about its database use. You can look at the following daemons with SNMP:
-
SevOne-clusterd
-
SevOne–datad
-
SevOne-dispatchd
-
SevOne-polld
-
SevOne–requestd
-
SevOne-trapd
-
etc.
The exact list of processes depends on the which appliance type you're monitoring, for example, PAS, HSA, or DNC.
SNMP indicators provide several database statistics for processes. The following are a few that you'll want to keep an eye on:
-
Query counts - any sudden changes in query counts may indicate a problem.
-
Query errors - query errors may be the result of a schema or code issue.
-
Number of connections
-
Number of reconnections
-
Number of traps received, processed, etc. (applies to SevOne-trapd) - you'll want to make sure that the number of traps received isn't much different from the number processed. The numbers should be close to each other (within 100, for example), if not the same. If there's a big difference in the number of traps received and processed, then you may be receiving more traps than you can handle.
Hot Standby Appliance
A hot standby appliance (HSA) consists of an active peer and a passive peer. The active peer pulls configuration data from the cluster master (in the case of a cluster) and polls data from objects and indicators on the devices that are assigned to it. The passive peer maintains a redundant copy of all configuration data and poll data. The following are important things to keep an eye on if you have an HSA:
-
Make sure MySQL replication is working. If Availability drops to 0%, then there may be an issue with the MySQL daemon (mysqld).
-
Make sure that the poller is running on the active appliance but not on the passive one.
-
Make sure that there's a lot of database activity on the active appliance but not on the passive one.
For HSA monitoring, we recommend using the Deferred Data plugin. You'll want to select the SevOne Statistics object ( for example, when using Instant Graphs) and the following indicators:
-
Is master
-
Is primary
If the passive peer of an HSA is reporting an Is primary value of 1, this indicates that a switchover has occurred. If both the active peer and the passive peer are reporting an Is primary value of 1, then a split-brain condition exists.
Interface
Because SevOne NMS monitors network devices, your SevOne appliance requires some bandwidth but not much. The normal range for a single appliance would fall somewhere between 1 and 3%. For an HSA, you'll see anywhere from two to four times as much bandwidth used. If the amount of bandwidth used is consistently high, this could indicate a problem, and you'll need to look into what's causing the high bandwidth.
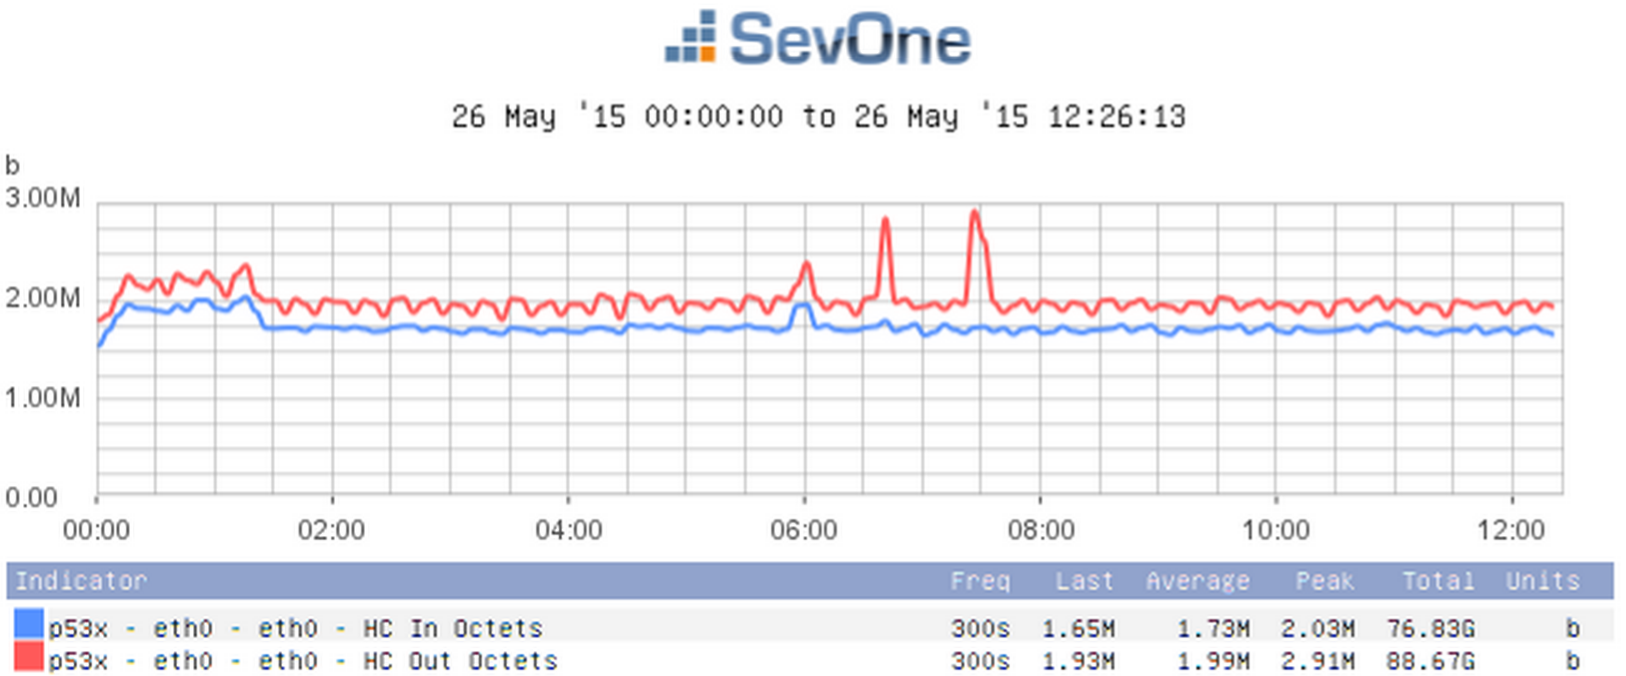
With an HSA, you'll see peaks in traffic every two hours. This happens because data is being transferred from short-term storage to long-term storage, which results in additional MySQL replication.
The graph below displays bandwidth information using the indicators HC In Octets and HC Out Octets.
Best Practices
Before continuing, please read through the following tips to optimize the self-monitoring process:
-
Check the basic Linux stats before looking for specific problems. In short, check the easy stuff before the hard stuff. This can save you a lot of time.
-
Make sure every single SevOne appliance is being monitored in some way.
-
If you have a cluster, we recommend against monitoring all appliances from the master. The reason for this is that if you monitor all appliances from the master, and the master happens to go down, then you lose all self-monitoring. It's best to balance the load across the cluster.
-
Don't monitor a SevOne appliance from itself. That said, if you have only one SevOne appliance, this may be your only option.
-
When selecting a peer appliance to monitor a specific appliance from, go with the peer that is geographically closest to the appliance you're going to monitor. This helps reduce latency.
-
In a hot standby setup, the active appliance and passive appliance together count as a single peer. So, ideally, you'll have an entirely different peer (as understood in this sense) looking at the active and passive appliances making up the peer being monitored.
-
Make sure all your SevOne appliances are together in their own device group. We'll talk about this more in just a minute.
-
In a cluster environment, make sure all appliances are in time sync. To do this, SSH into any appliance in the cluster and enter the following command:
SevOne-peer-dodate
Getting Started
In this section, we'll go over the things you need to do to get your appliances ready for self-monitoring. We'll be looking at the following:
-
The SevOne device group
-
Adding an appliance to the Device Manager
-
Enabling self-monitoring on an appliance
-
Creating object rules
The SevOne Device Group
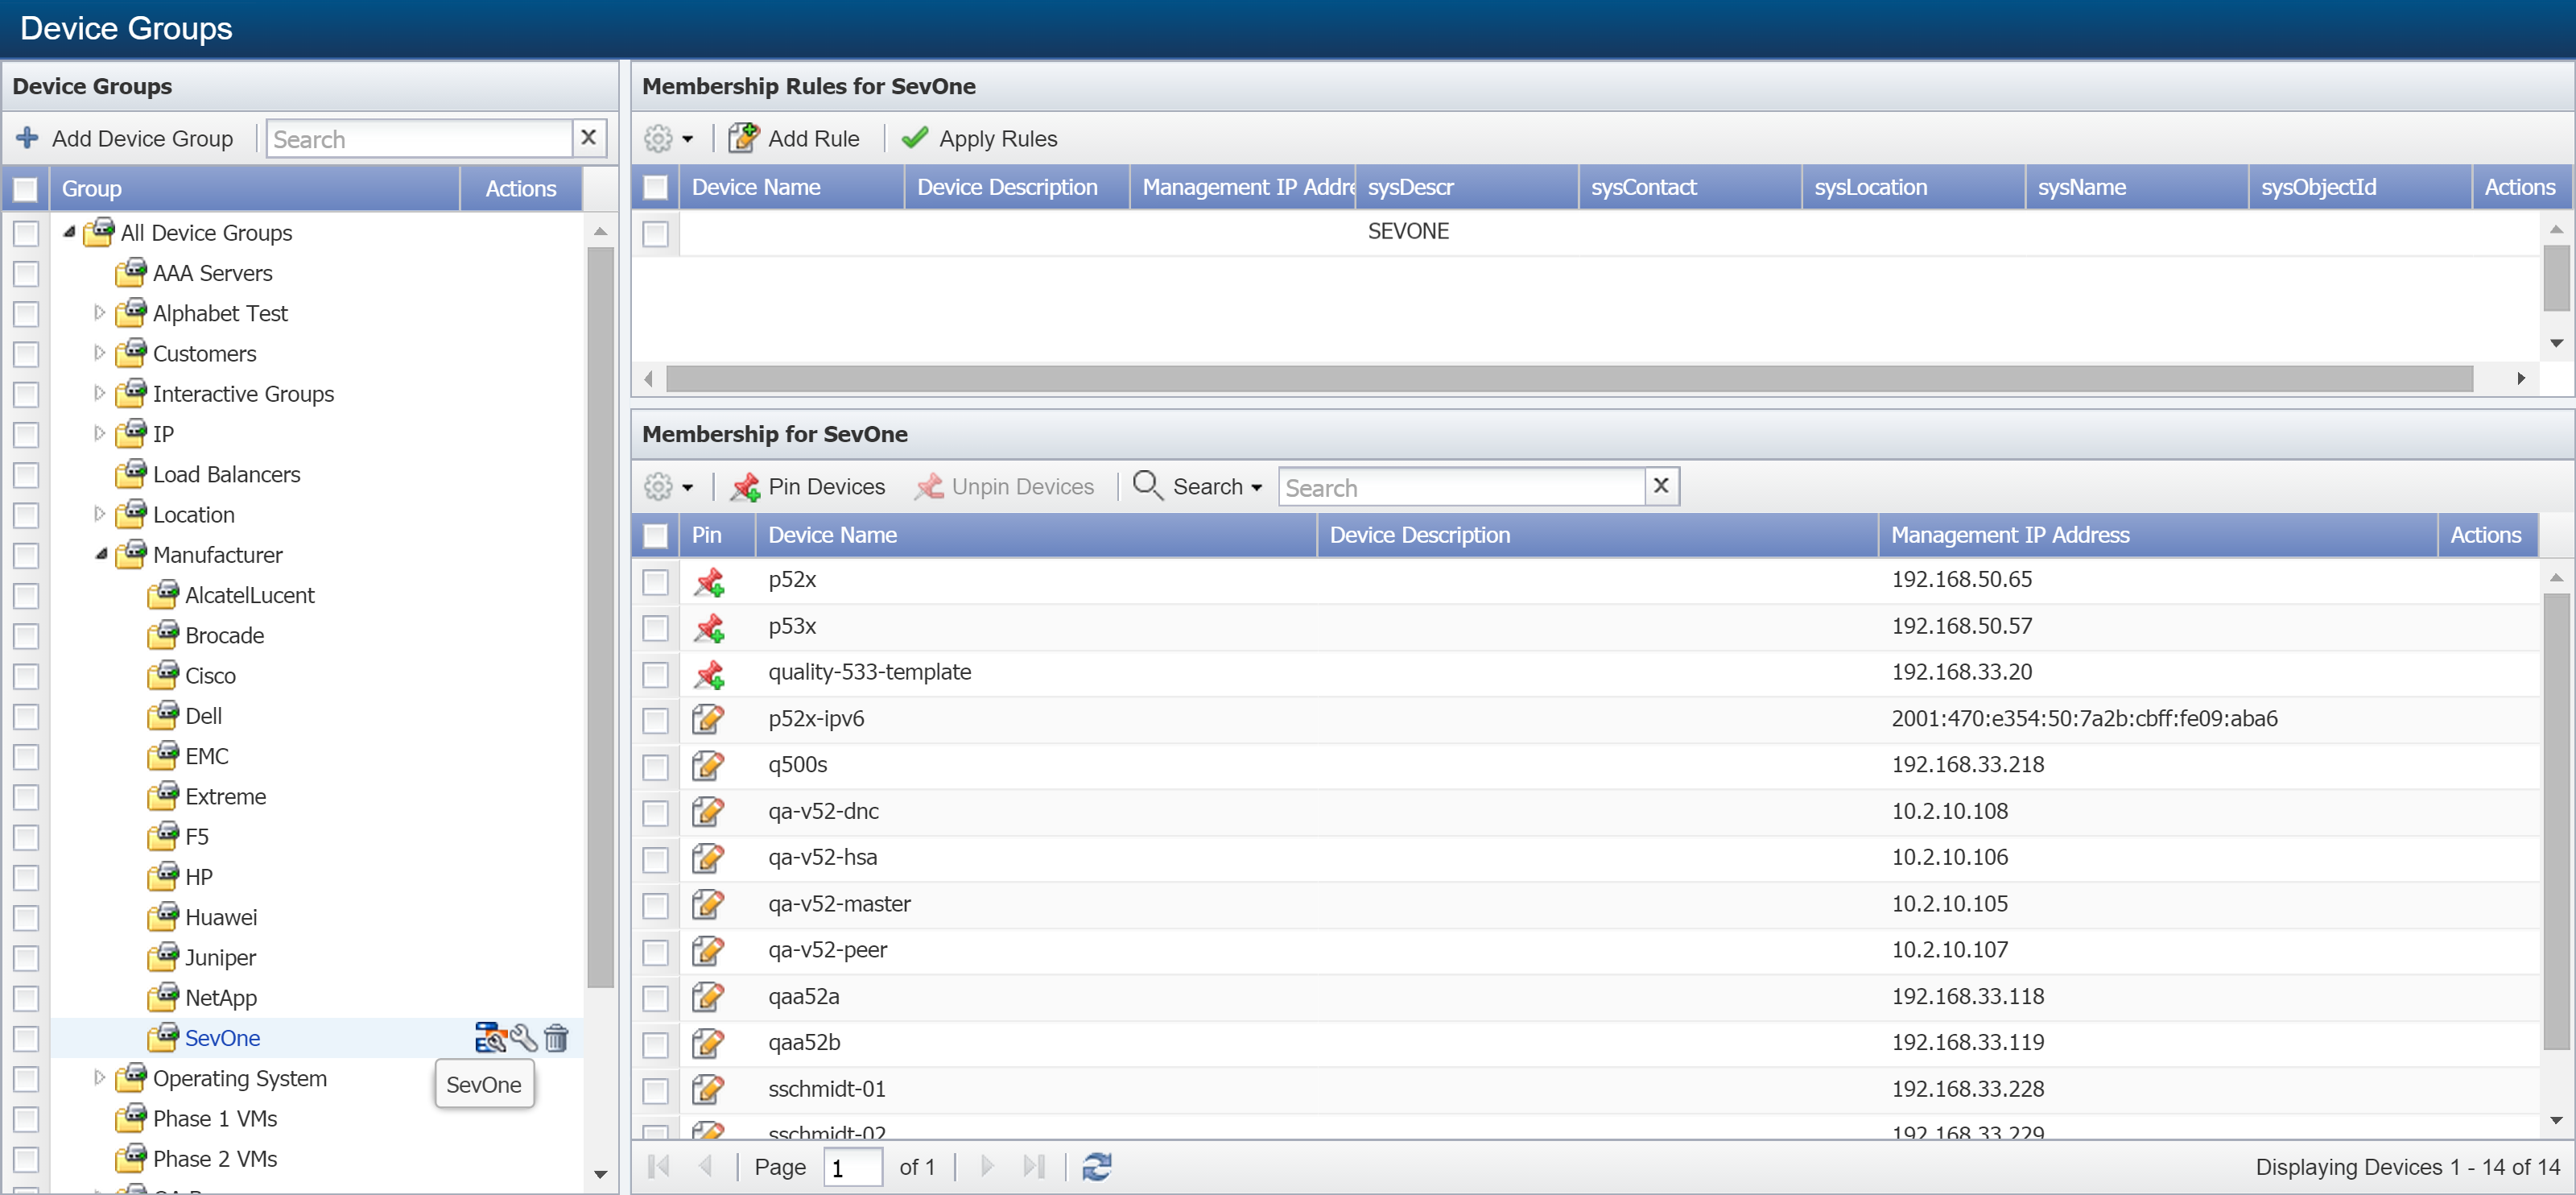
In the Best Practices section, we recommended putting all of your appliances in their own device group. There's an existing device group called SevOne, and we strongly suggest adding any SevOne appliances that you want to monitor to this group.
To look at the SevOne device group, perform the following steps:
-
From the navigation bar, click Devices and select Grouping. Then select Device Groups.
-
On the left, under Device Groups, click
 next to All Device Groups to expand the section.
 -
Click
 next to Manufacturer.
 -
Select the SevOne device group.
On the upper right pane, under Membership Rules for SevOne, you'll notice that sysDescr is set to SEVONE. For more information on device groups, refer to our documentation on the topic.
There's no need to do anything at this point. We'll be talking about the SevOne device group again in the next section.
Add SevOne Appliance to Device Manager
In order to monitor your SevOne appliance, you'll need to add it to the Device Manager just as you would any other device that you want to monitor. The following steps will walk you through the process.
-
First, select the appliance that you would like to monitor your appliance from. You'll be working from that appliance. For example, let's say you want to set up Appliance A to be monitored, and you've decided that Appliance B will do the monitoring. That means you'll need to work from Appliance B.
-
Now that you've selected the appliance that will do the monitoring, log into SevOne NMS on that appliance.
-
From the navigation bar, click Devices and select Device Manager.
-
Click
 and select Add New Device.
-
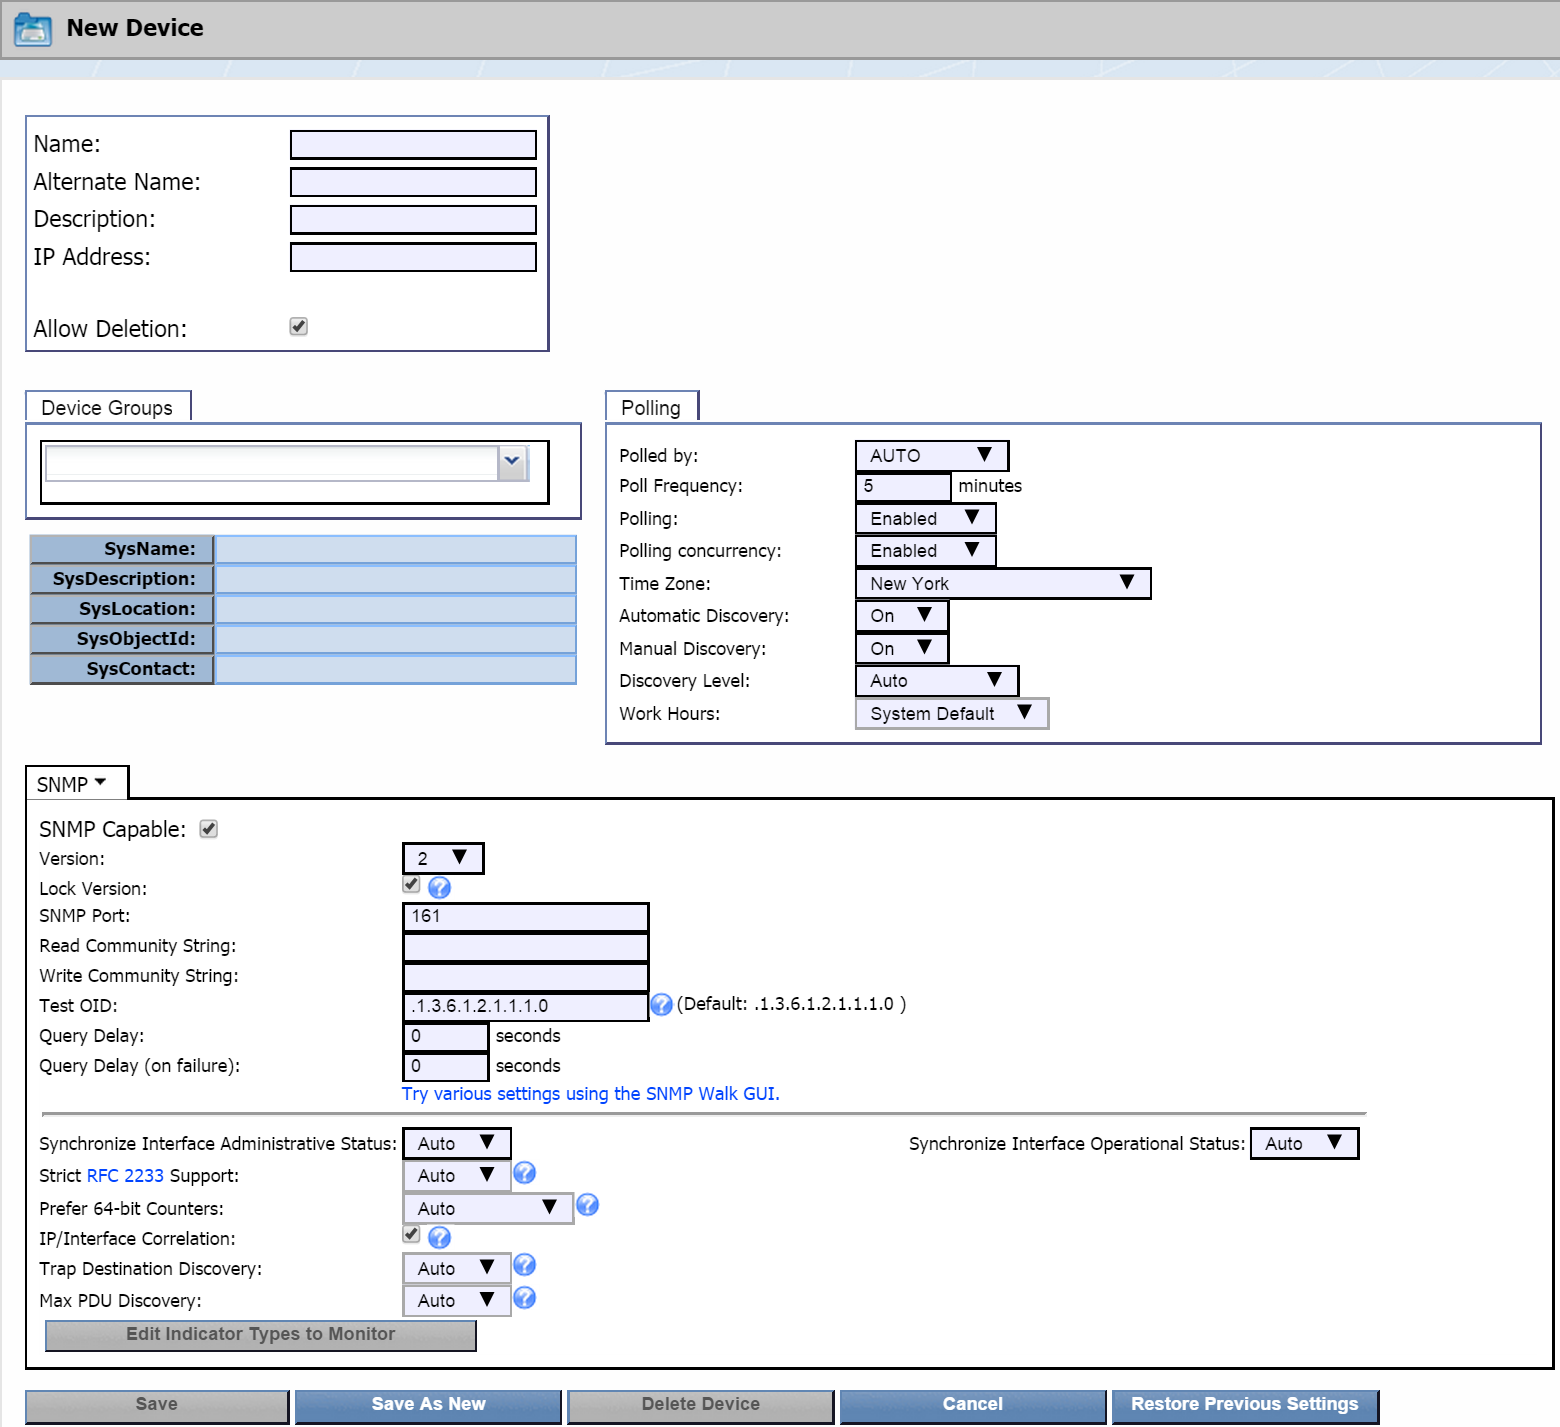
At the top of the New Device page, in the Name field, enter the name of the appliance that you want to monitor.
-
In the Alternate Name field, enter an alternate name for the appliance. Users can search for the appliance by this name.
-
In the Description field, enter a description of the appliance. You can use this to provide additional information about the appliance, such as location, etc.
-
In the IP Address field, enter the IP address of the appliance.
-
The Allow Deletion check box appears to the admin user only and is selected by default. When selected, it enables users to delete the device. If you would like to prevent users from deleting the appliance as a device, clear the check box.
-
Below that, click the Device Groups drop-down. Click + next to Manufacturer and select the SevOne check box.
-
Configure other settings as needed. For more information on the settings, please see our documentation on adding/editing devices.
-
Click Save As New.
-
You'll see a message at the top of the page letting you know that the device is being queued for discovery.
Enable Self-monitoring on Appliance
In this section, you'll be working with the appliance that you want to monitor.
-
Open your SSH client and log into the appliance that you want to enable self-monitoring on.
-
Enter the following command to run the install.sh script:
/usr/local/scripts/utilities/plugins/selfmon/install.sh -
You'll see a couple of warnings followed by the text Press Ctrl-C to abort or any key to continue... Hit Enter to proceed.

-
You'll see one more message, Press Ctrl-C to abort or any key if you are sure... Hit Enter again.
-
Next, you'll be prompted to ente r the password for the API user SevOneStats. Enter the following:
n3v3rd13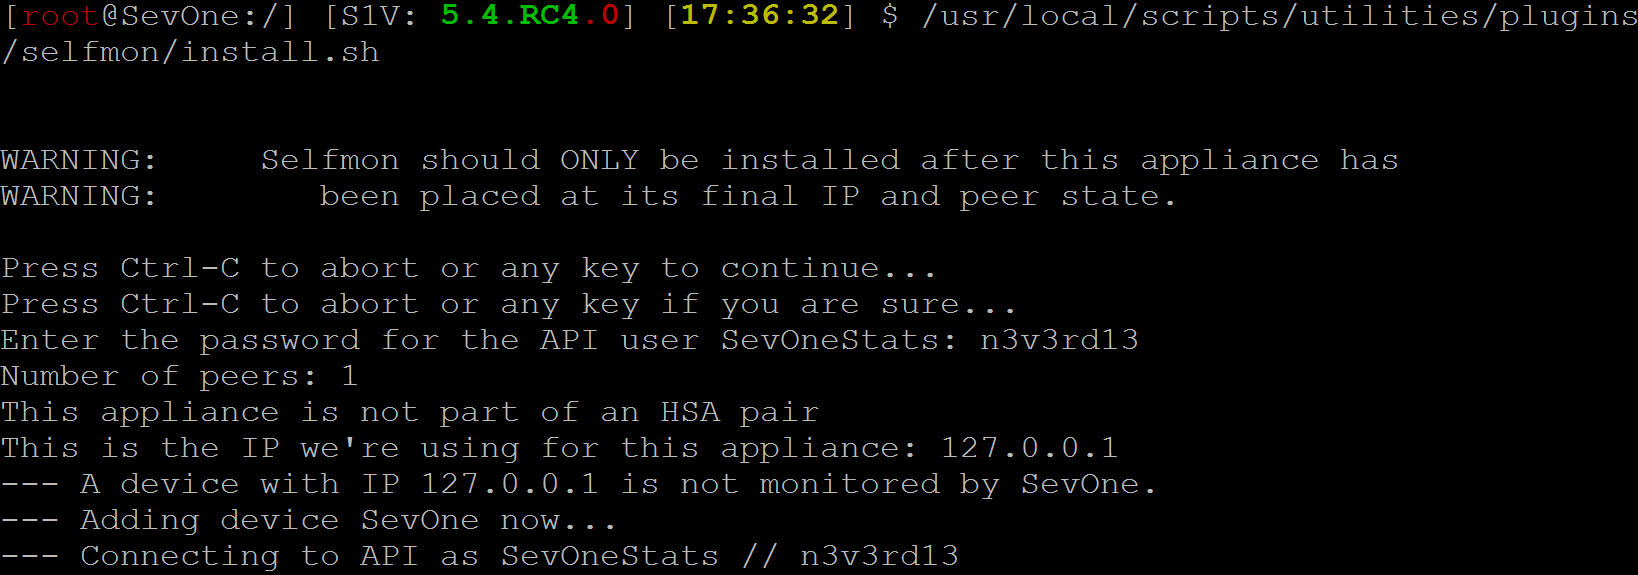
Now you should see some information about your appliance–such as number of peers, whether the appliance is part of an HSA pair, and the IP address used for it. Soon after that, the installation process will start. You'll see a long list of information, especially about objects and indicator types. Once that's done, you should receive confirmation that the installation is complete.
Create Object Rules
By creating object rules, you can make sure you're monitoring the objects you care about on your SevOne appliance. You can also use object rules to exclude the objects that you don't want to monitor. Perform the following steps to create object rules.
For this part, go to the appliance that will be doing the monitoring and log into SevOne NMS.
-
To access the Object Rules page from the navigation bar, click Administration. Under Administration, select Monitoring Configuration, then Object Rules.

-
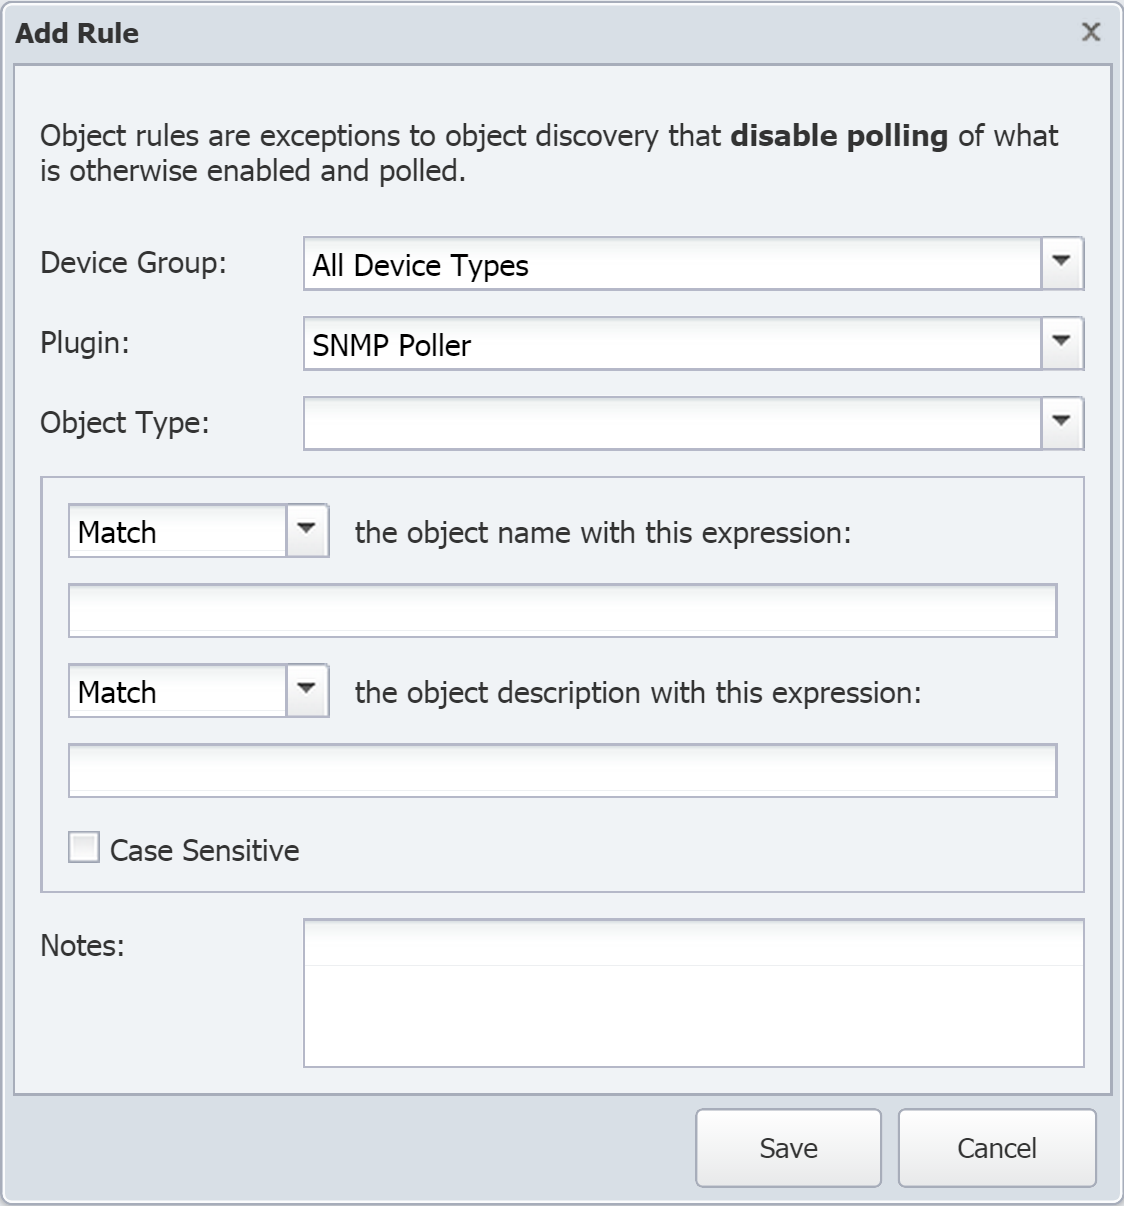
Click Add Rule to bring up the Add Rule pop-up.
-
Click the Device Group drop-down and select a device group. Select the device group that the appliance you wish to monitor belongs to (for example, the SevOne device group).
-
Click the Plugin drop-down and select a plugin.
-
Click the Object Type drop-down and select an object type.
-
Click the Subtype drop-down and select an object subtype.
-
The next drop-down is set to Match. This means that the object rule will be applied if the object name matches the expression that you specify (you'll specify this in the next step). If you want the object rule to apply when the object name doesn't match the expression, then click the drop-down and select Do not match.
You'll need to set at least one match expression. You can set an expression here, for the object name, or you can set one below, for the object description. You can also set expressions for both the name and the description if you like.
-
In the text field directly below, enter a Perl regular expression that you want the object name to match or not match. If you don't want to check the object name against an expression, just leave this blank.
-
The next Match/Do not Match drop-down applies to the object description, rather than the object name. Click the drop-down and select Match or Do not match if you plan on specifying an expression in the next step.
-
In the text field directly below, enter a Perl regular expression that you want the object description to match or not match. If you don't want to check the object description against an expression, just leave this blank.
-
Select the Case Sensitive check box to require expressions to match the case used in the object name/description. If you don't require the case to match, leave the check box clear.
-
In the Notes field, enter any comments that you would like to include about the object rule. This is optional.
-
Click Save.
Self-Monitoring in Action
In this section, we'll walk through the following self-monitoring topics. We'll be incorporating a few specific examples in most of the subsections. Feel free to try these on your own as you read through the steps!
-
Policies and thresholds
-
Alerts
-
Instant Graphs
For this portion, make sure that you're working on the appliance that will be doing the monitoring.
Policies and Thresholds
Policies
By creating policies, you can receive alerts when the conditions you specify are triggered. Policies let you define thresholds for device groups or object groups. For now, we're going to focus on device groups.
In the steps below, we're going to create a policy that will alert us if the average used disk space is greater than or equal to 80% for thirty minutes.
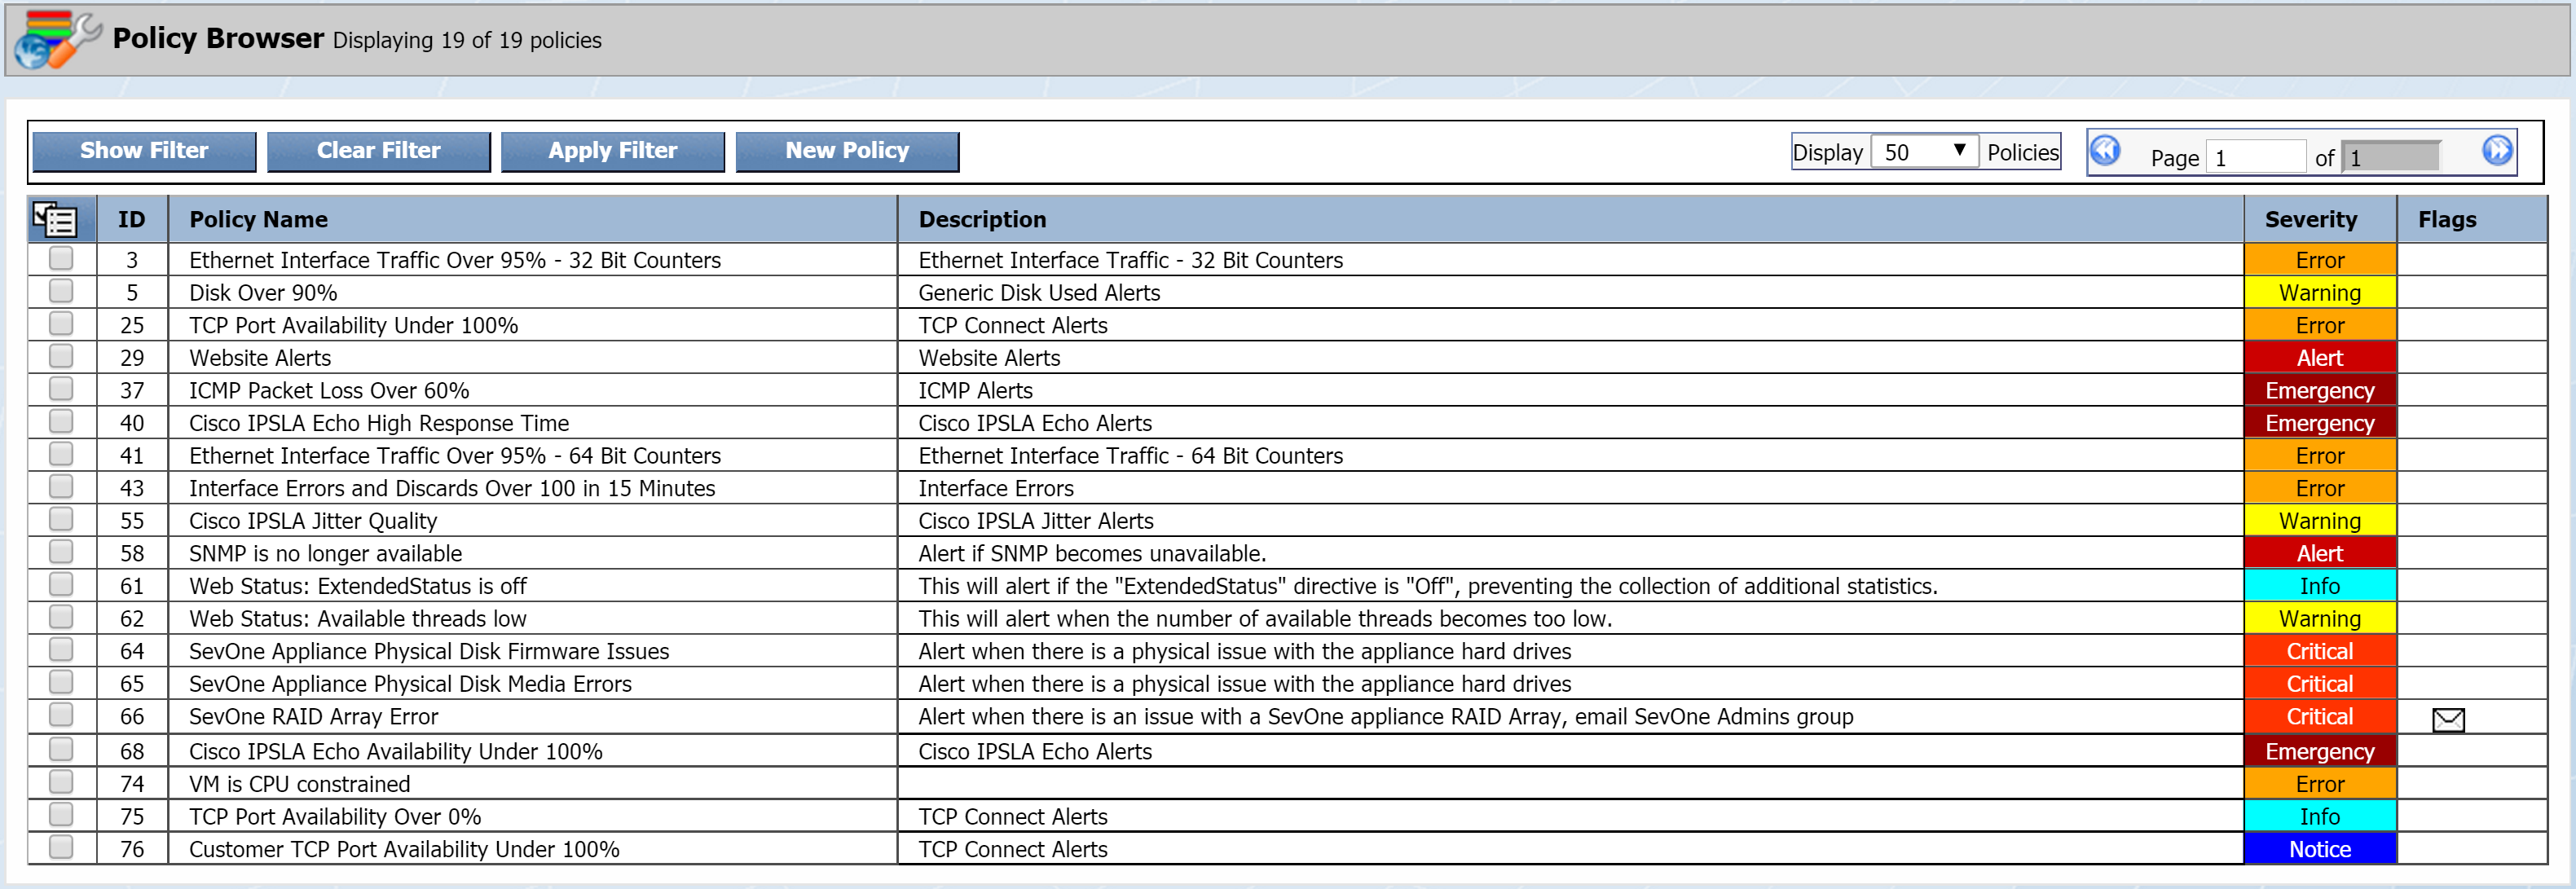
To access the Policy Browser from the navigation bar, click Events and select Configuration. Then select Policy Browser. Once you get there, you'll likely see some existing policies.
General Settings tab
Here you can define basic policy settings.
-
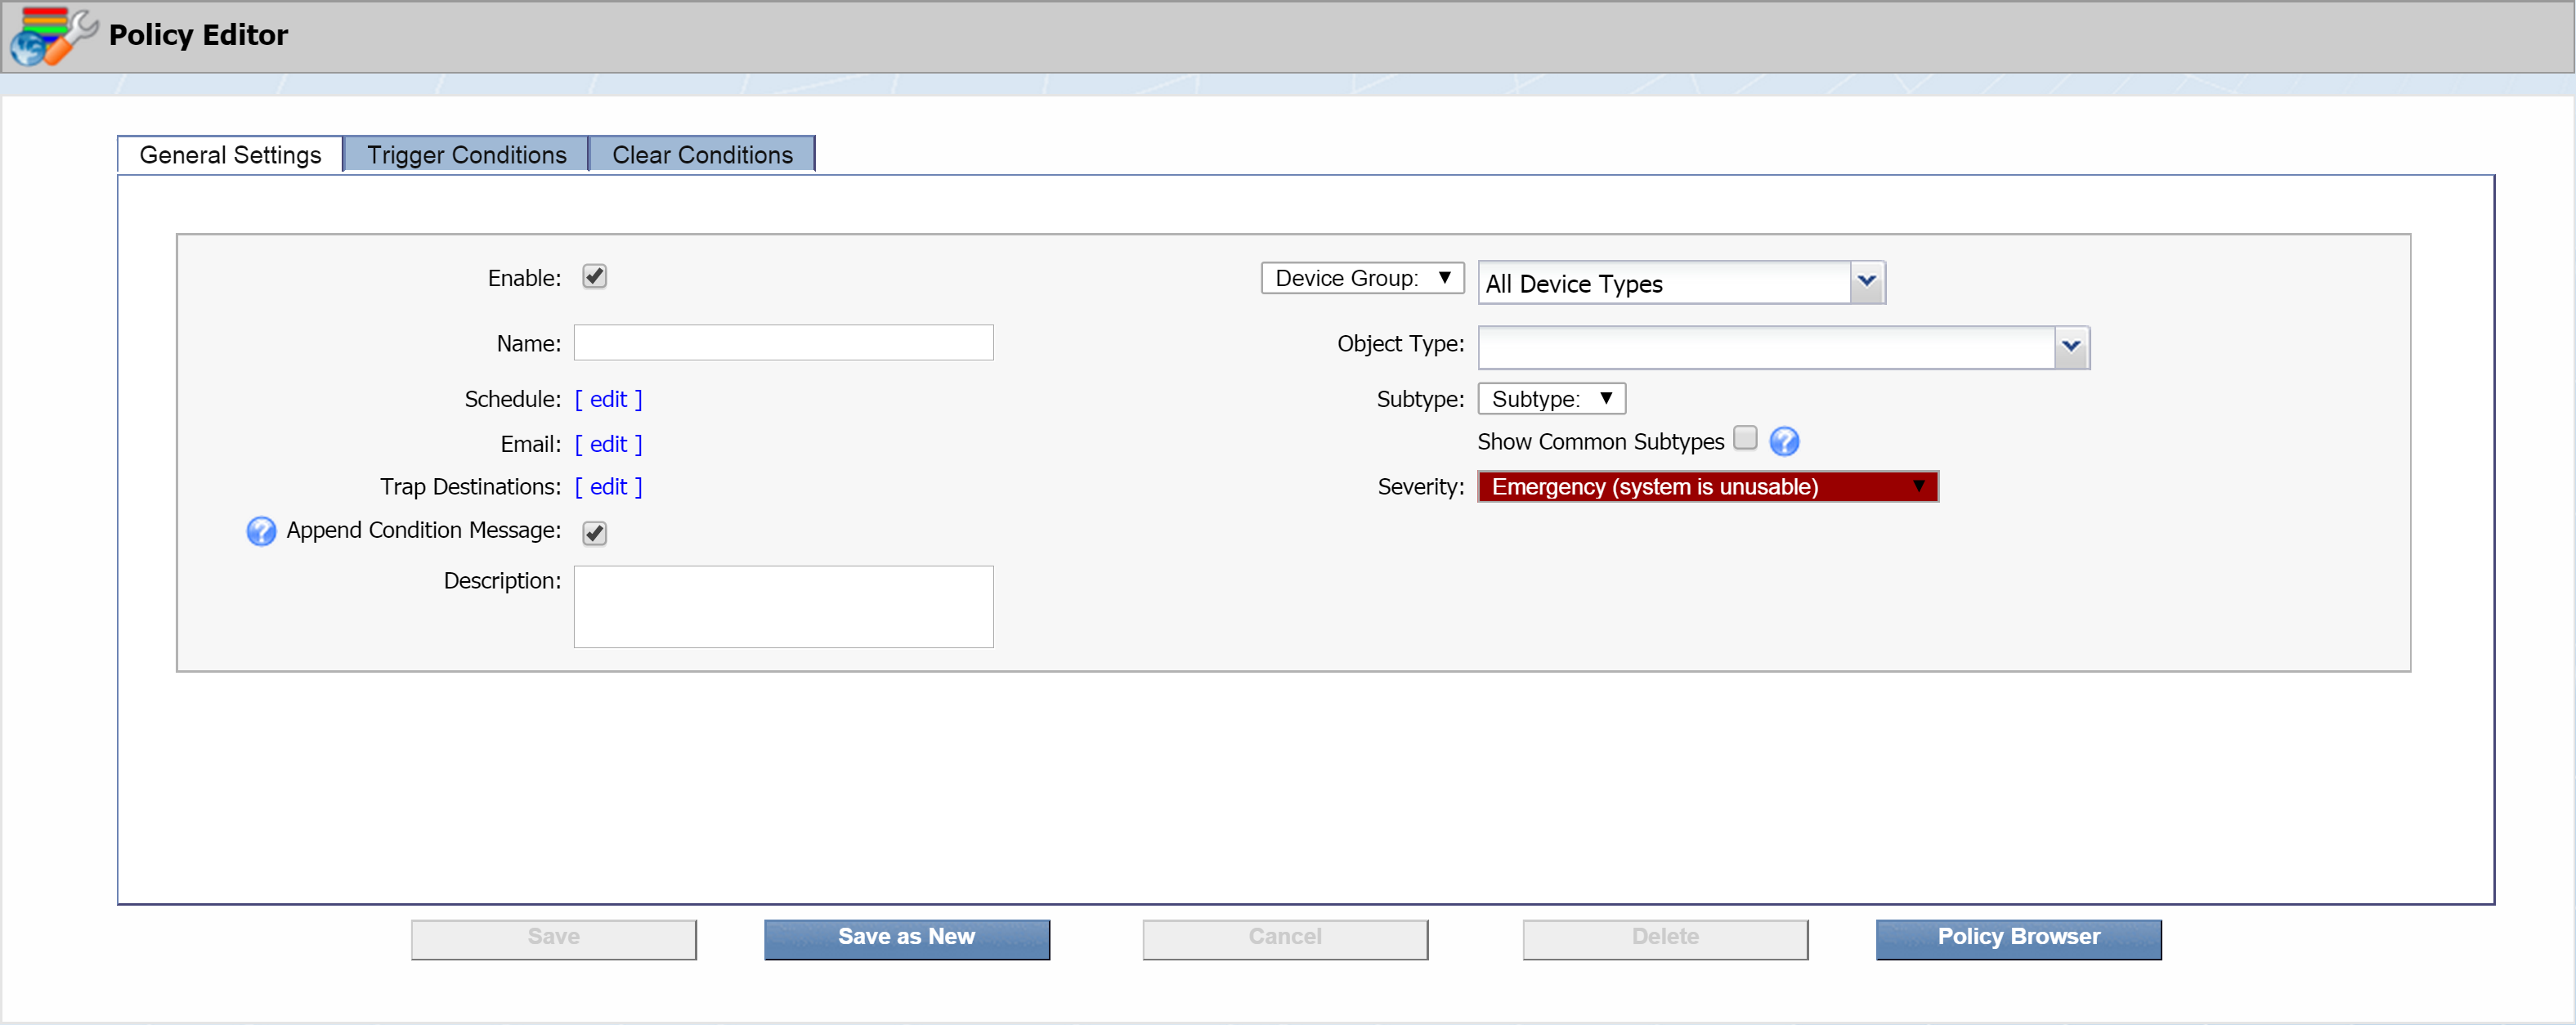
Click New Policy to bring up the Policy Editor.
-
The Enable check box is selected by default. Go ahead and leave it that way. This indicates that the policy is active.
Disabled policies appear in light text on the Policy Browser.
-
In the Name field, enter the name of your policy. Let's call this one SevOne_DiskUtilizationYellow .
-
The next field, Schedule, lets you define specific time spans to enable or disable the alert engine to test the policy. The alert engine runs every three minutes to retest all the policies. For our current policy, that's what we want, so we're going to leave this alone.
-
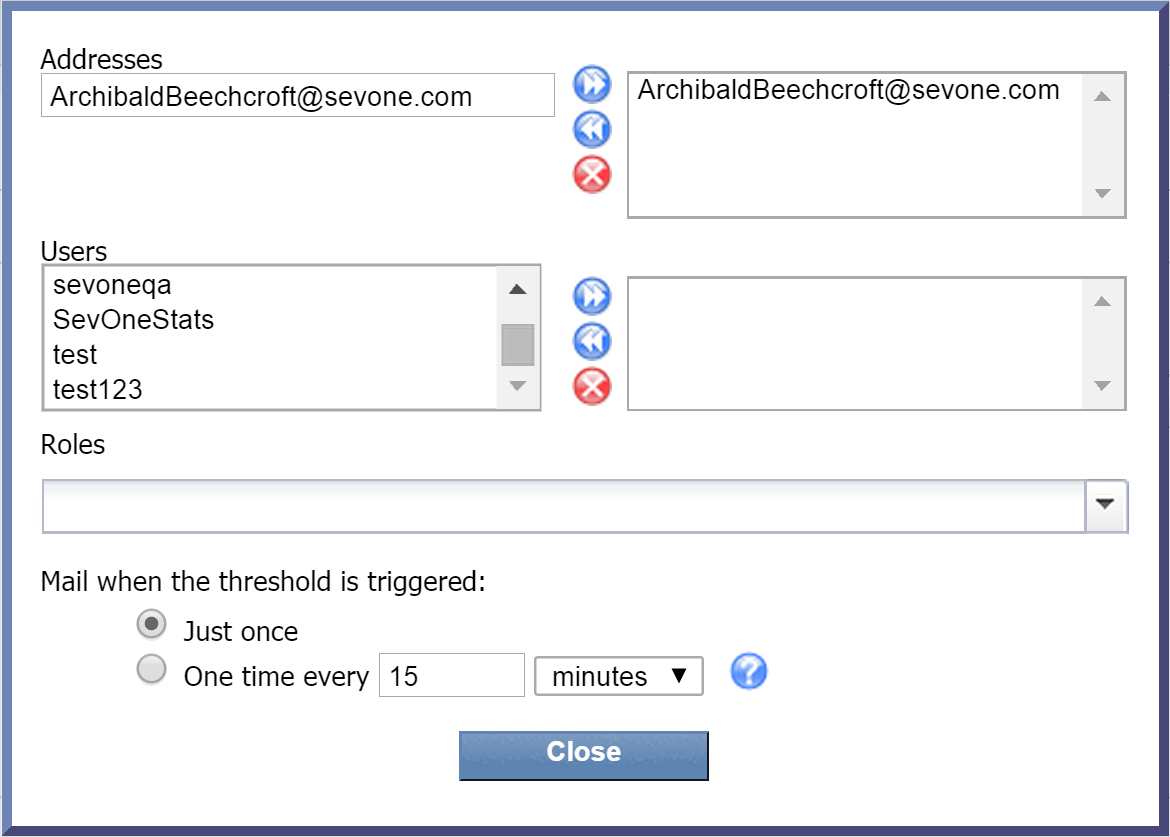
Next to Email, click edit to display a pop-up that lets you specify who should receive email when the policy triggers an alert. You have three options here, and they're not mutually exclusive:
-
Addresses - manually enter one or more email addresses. Once you've entered an email address, click
 to add it. Email addresses that you've added will appear in the column on the right.
 -
Users - select one or more users from the Users list and click
 to add your selection(s).
 -
Roles - click the Roles drop-down and select the check box next to one or more user roles to add as recipients.
Now click Close.
-
-
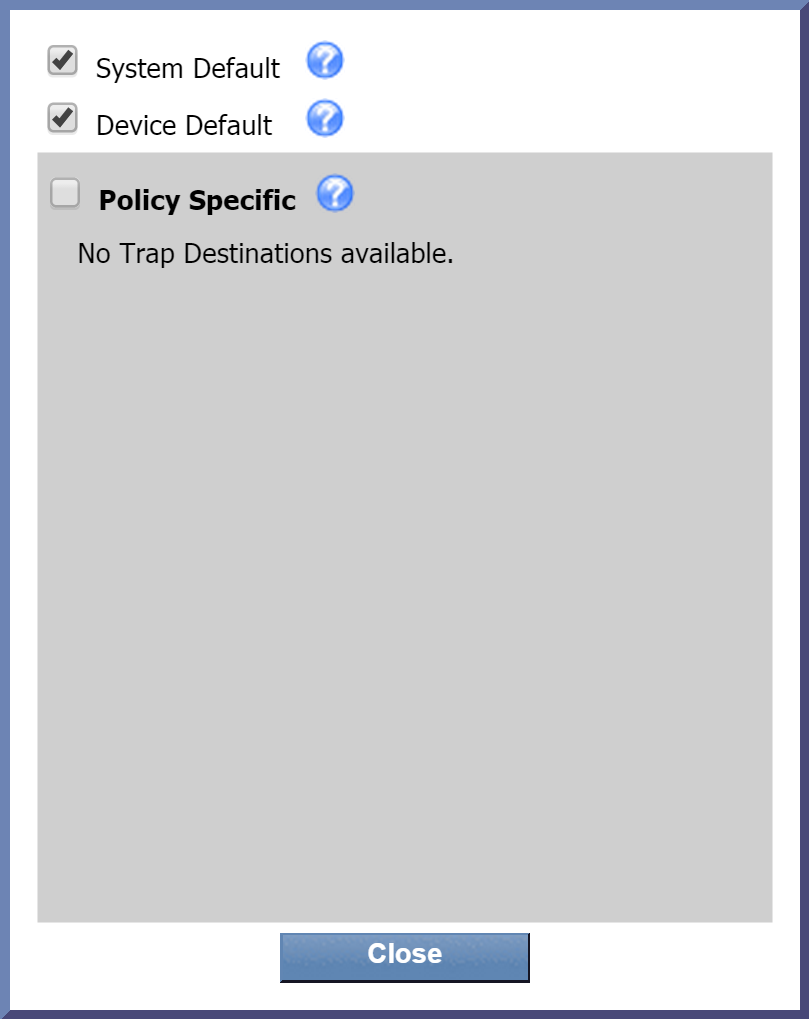
Next to Trap Destinations, click edit to display a pop-up that lets you specify where to send traps from the policy. By default, the first two check boxes are selected. Let's go with that. Now click Close.
-
The Append Condition Message check box is selected by default. Go ahead and leave it this way. On the next two tabs, we'll be setting up trigger conditions and clear conditions. On the Trigger Conditions tab, we'll be able to create a trigger message. We'll also have the option of creating specific messages for each condition of the trigger. By selecting this check box, all of the condition-specific messages we create will be appended to the trigger message. The same concept applies to the Clear Conditions tab.
-
In the Description field, enter a description of the policy. Let's enter Triggers if any SevOne appliance is low on disk space.
-
The Device Group drop-down is set to Device Group (as opposed to Object Group). Go ahead and leave it that way.
-
In the drop-down next to Device Group, you can specify a device group to apply the policy to. Under All Device Groups, click + next to Manufacturer and select SevOne.
-
Click the Object Type drop-down. Click + next to SNMP Poller. Then select Disk.
You won't be able to edit this field once you've saved the policy. This also applies to the next field, Subtype.
-
The Subtype drop-down is set to All Subtypes. You don't need to do anything here.
If you select the check box next to Show Common Subtypes, only the common object subtypes will appear. You specify object subtypes as common using the Object Subtype Manager.
-
Click the Severity drop-down to select a severity level to display on the Alerts page when the policy triggers an alert. Select Warning (warning condition) for our example.
For this policy, we're going to specify an alert to be triggered if the disk space used is equal to or greater than 80%. So, we've designated our severity level as Warning. We could also create a policy just like this one except that we specify an alert to trigger when the disk space used is equal to or greater than 90%. In that case, we'd want a higher severity level, so we might go with Alert, for example.
Trigger Conditions tab
This is where you can define the conditions to trigger the policy. You'll also be able to create a trigger message and condition messages.
If you define a trigger condition, and then define a clear condition (see Clear Conditions Tab) that contradicts it, the trigger condition will take precedence. For example, say you have a trigger condition to trigger an alert when packet loss is greater than 60% for fifteen minutes. You might define a clear condition that clears the alert once packet loss is less than 60% over fifteen minutes, and this would clear the trigger condition. However, if you instead define the clear condition to clear the alert when packet loss is greater than 65% for fifteen minutes, it won't clear the alert that was triggered. This is because packet loss is still over the number you specified (60%) as the limit in your trigger condition.
-
Select the Trigger Conditions tab. In the upper section of the tab, you'll see the object type information that you selected on the General Settings tab.

-
In the Trigger Message field, enter the message that you want to display for this policy on the Alerts page. For this one, let's enter Disk space on $deviceName is getting low. By including the $deviceName variable, we'll be able to see the name of the device that triggered the alert.
Remember the Append Condition Message check box on the General Settings tab? It was selected by default, which means that when we create custom messages for specific conditions in just a minute, they'll be appended to the trigger message that we just created. (The same thing applies to condition messages for the clear message, which we'll discuss in just a bit.)
-
Under Conditions, click
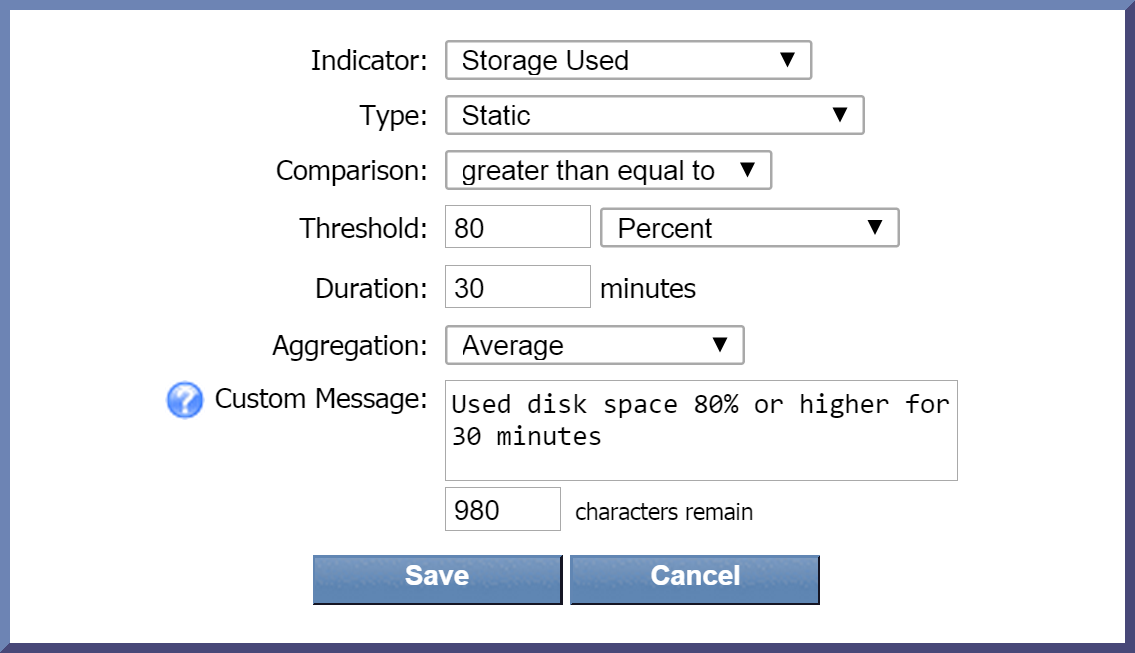
 and select Create New. Perform the following actions to define your new condition.
-
Click the Indicator drop-down and select an indicator to base the condition on. For this condition, we're going to select Storage Used.
-
The Type drop-down is set to Static by default. Leave this as it is. This will compare the current indicator value to the indicator value that you define.
-
Click the Comparison drop-down and select a comparison operator. Let's go with greater than equal to.
-
In the Threshold field, enter the value to trigger the condition. Enter 80 here.
-
Now click the drop-down to the right of the Threshold field and select a unit of measure for the threshold. Let's select Percent.
-
In the Duration field, enter the number of minutes for the condition to be met before triggering an alert. Enter 30 here. This means that if the amount of used disk space is 80% or higher for 30 minutes, the condition will trigger an alert. If the used disk space is 80% or higher but only for 20 minutes, for example, an alert won't be triggered.
-
The Aggregation drop-down is set to Average as the default data aggregation method. Just leave it as it is.
-
In the Custom Message field, you can enter a message specific to this condition. For this one, let's say Used disk space 80% or higher for 30 minutes. Since we've specified that we want custom messages appended to the trigger message, this condition message will append to our trigger message.
-
Now click Save.
-
Our new condition appears under Conditions. Since it's the first condition, it's listed as Condition A.

-
-
In the Rules section, a new rule has been created as a result of the condition we just created. Since it's the first rule, it's listed as Rule 1. This new rule contains one condition: Condition A.
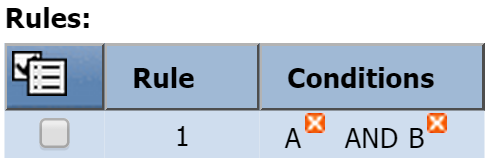
If you create another condition, it'll be added to this rule using the AND Boolean operator. For example, Rule 1 would now contain Condition A AND Condition B.
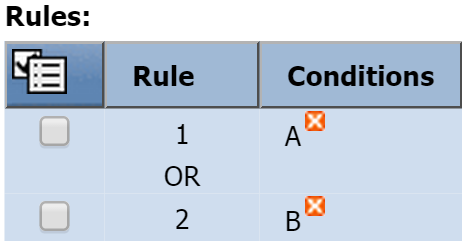
If you'd prefer to apply an OR operator, you would first create a second rule (Rule 2). Then delete Condition B from Rule 1. After you've done that, select the check box for Condition B and add it to Rule 2 (click and select Add to Rule 2).
This is where you can define the conditions to clear the alert. If you don't define a clear condition, then the alerts triggered by the trigger condition will display on the Alerts page until you manually acknowledge them. In the following steps, we're going to define a clear condition to clear the triggered alert (defined on the Trigger Conditions tab) once the used disk space is 65% or lower for thirty minutes.
-
Select the Clear Conditions tab. You'll notice that it has an uncanny resemblance to the Trigger Conditions tab.

-
In the Clear Message field, enter the message to display when the alert has been cleared. For example, you might say something along the lines of $deviceName is reporting increase in free disk space.
-
Under Conditions, click
 and select Create New. Perform the following actions to define your new condition.
-
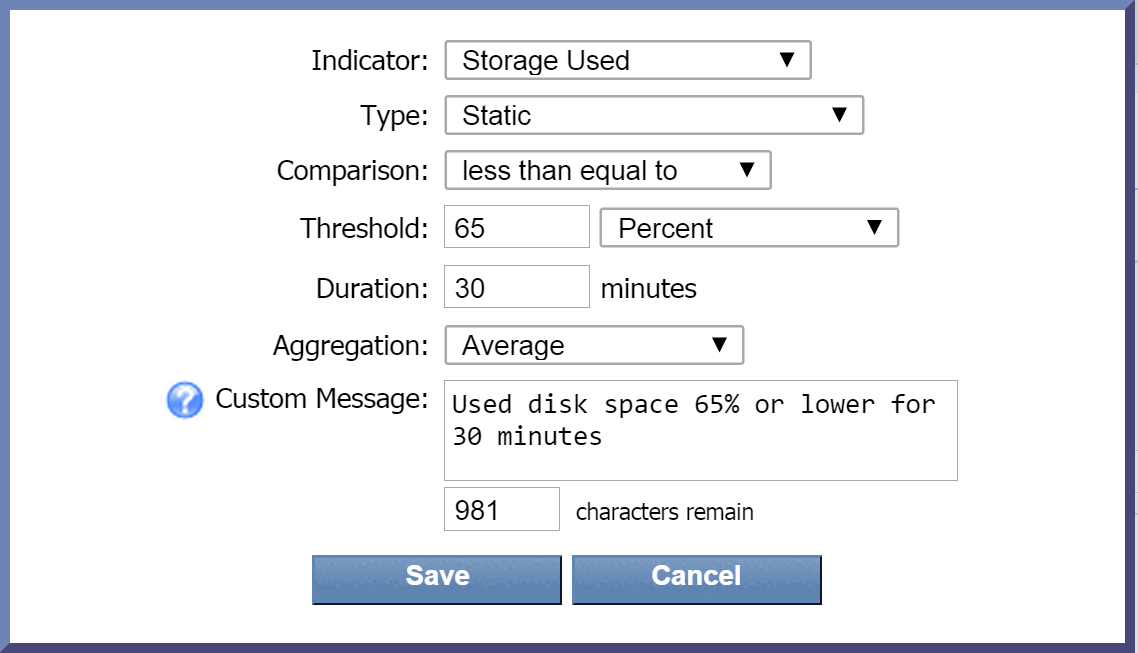
Click the Indicator drop-down and select an indicator to base the condition on. For this condition, we're going to select Storage Used as we did on the Trigger Conditions tab.
-
For the Type drop-down, let's go with the default, Static, again.
-
Click the Comparison drop-down and select a comparison operator. This time we're going with less than equal to.
-
In the Threshold text field, enter the value to trigger the condition. Enter 65 here.
-
Now click the drop-down to the right of the Threshold field and select Percent as the unit of measure for the threshold
-
In the Duration field, enter the number of minutes for the condition to be met before the alert can be cleared. Enter 30 here. This means that if the amount of used disk space is 65% or lower for 30 minutes, the alert that was triggered will be cleared. If the used disk space is 65% or lower but only for 20 minutes, for example, the alert won't be cleared.
-
The Aggregation drop-down is set to Average as the default data aggregation method. Just leave it as it is.
-
In the Custom Message field, you can enter a message specific to this condition. For this one, let's say Used disk space 65% or lower for 30 minutes. Earlier, we specified that we want custom messages appended to the clear message, so this message will append to our clear message.
-
Now click Save.

-
Thresholds
If you want to define thresholds for a specific device rather than a device group, you can create a threshold. In this section, we're going to create a threshold similar to the policy we created above. You'll notice that the steps are a lot like the ones in the previous section. The main difference here is that this threshold applies to a specific device instead of a device group.
In the steps below, we're going to create a threshold that will alert us if the CPU idle time for a specific device is less than 20% over a fifteen-minute period.
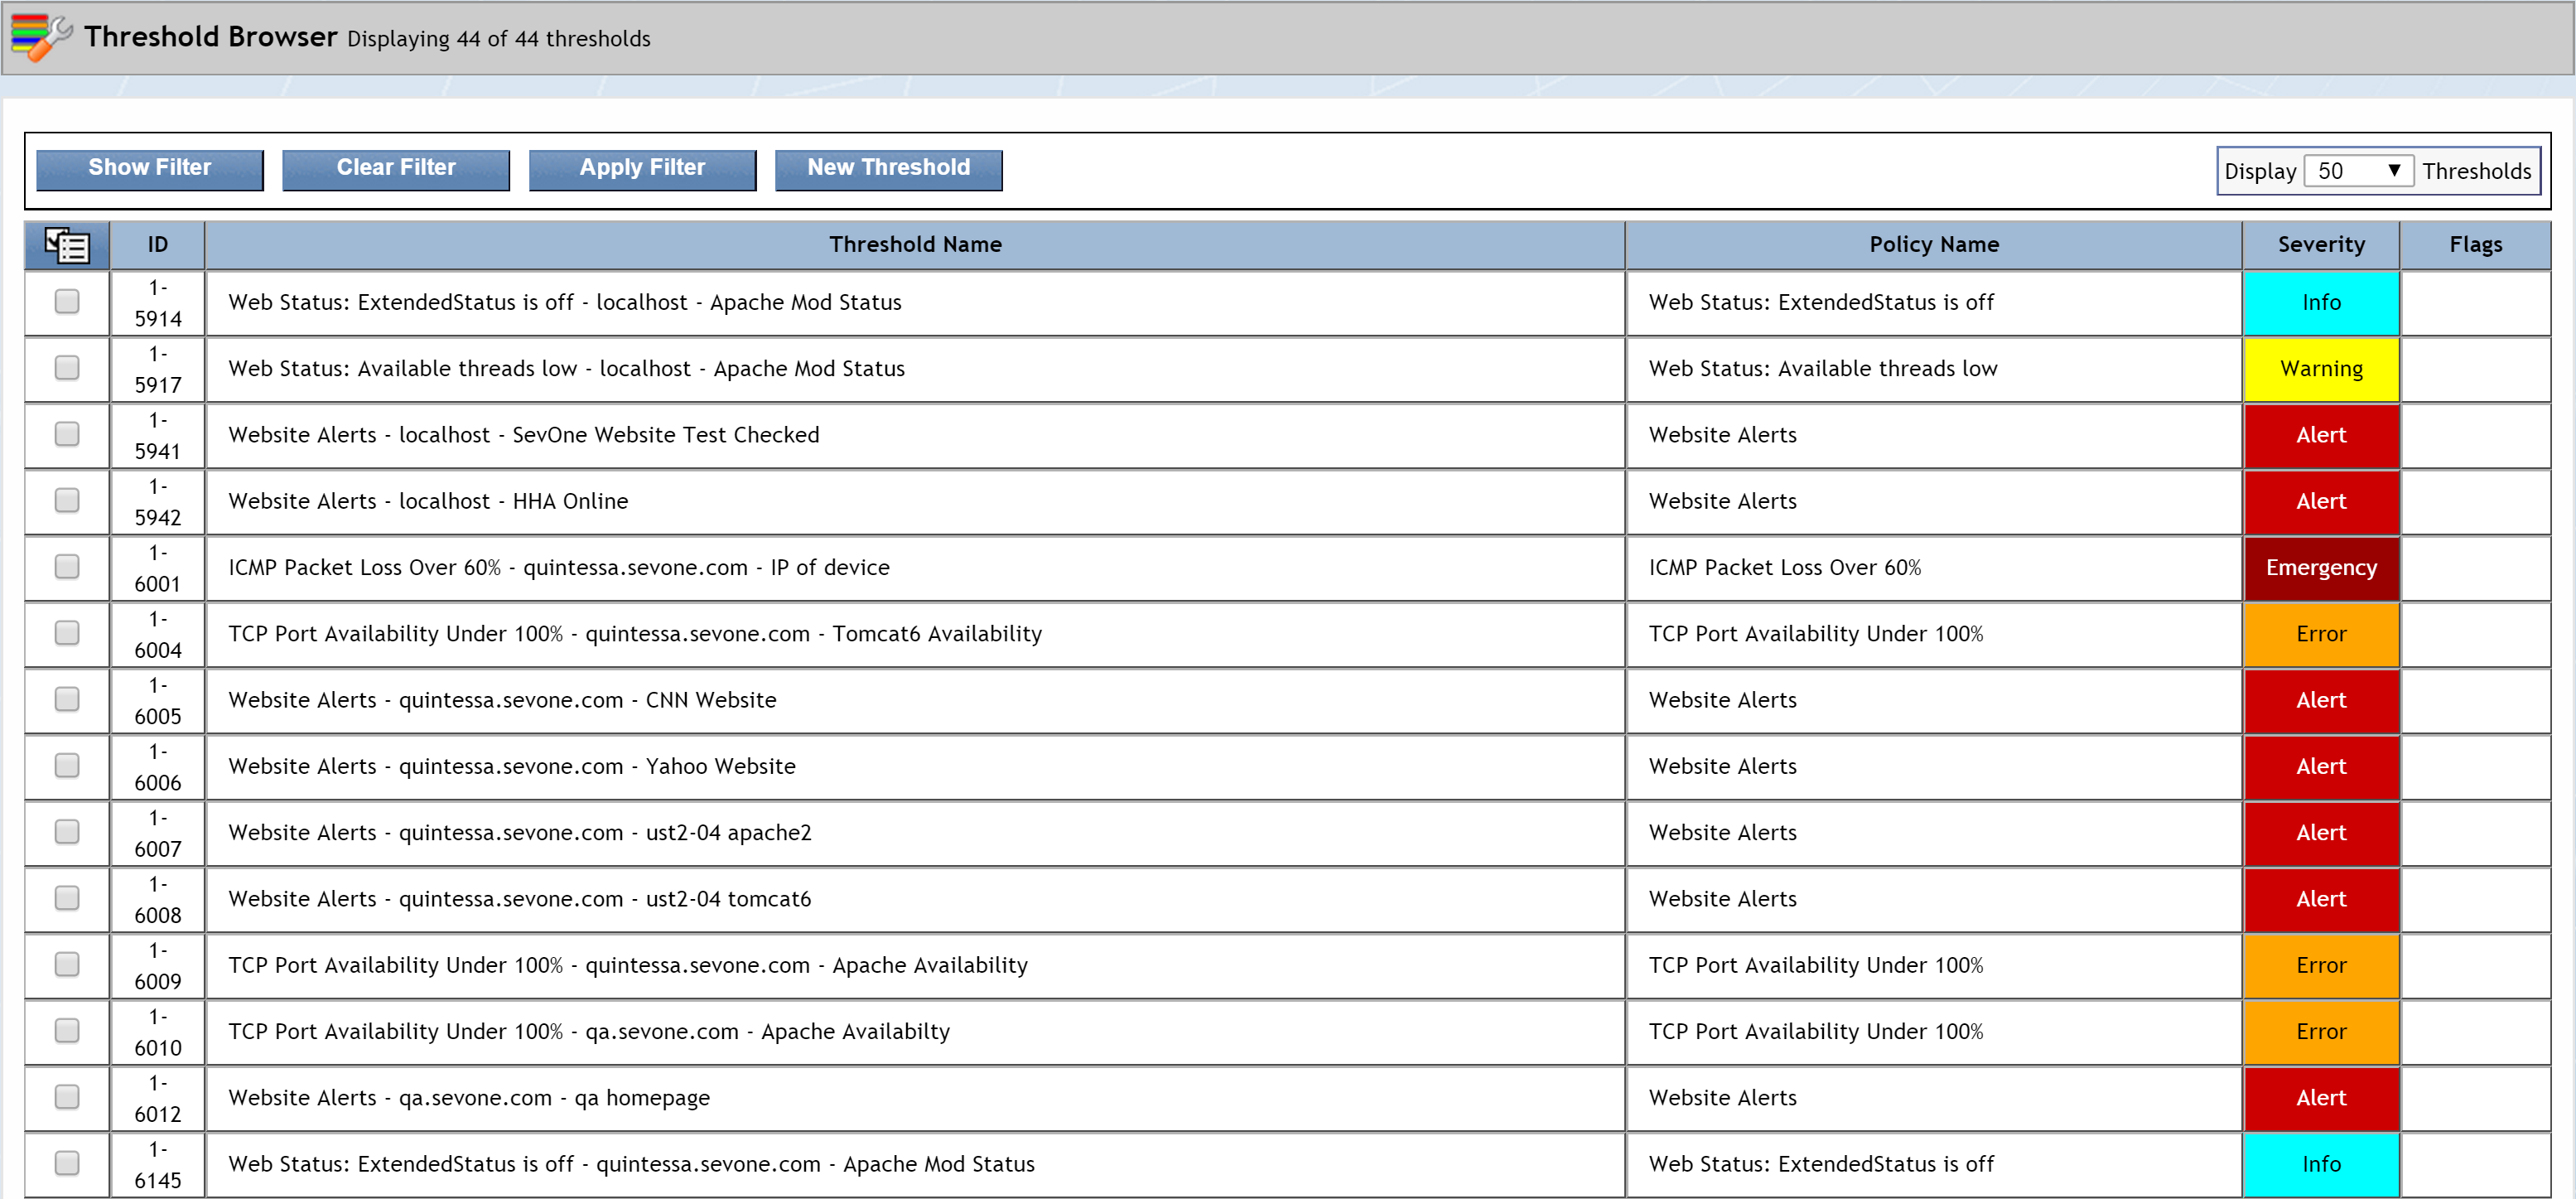
To access the Threshold Browser from the navigation bar, click Events and select Configuration. Then select Threshold Browser. Once you get there, you may see some existing thresholds.
General Settings tab
Here you can define basic threshold settings.
-
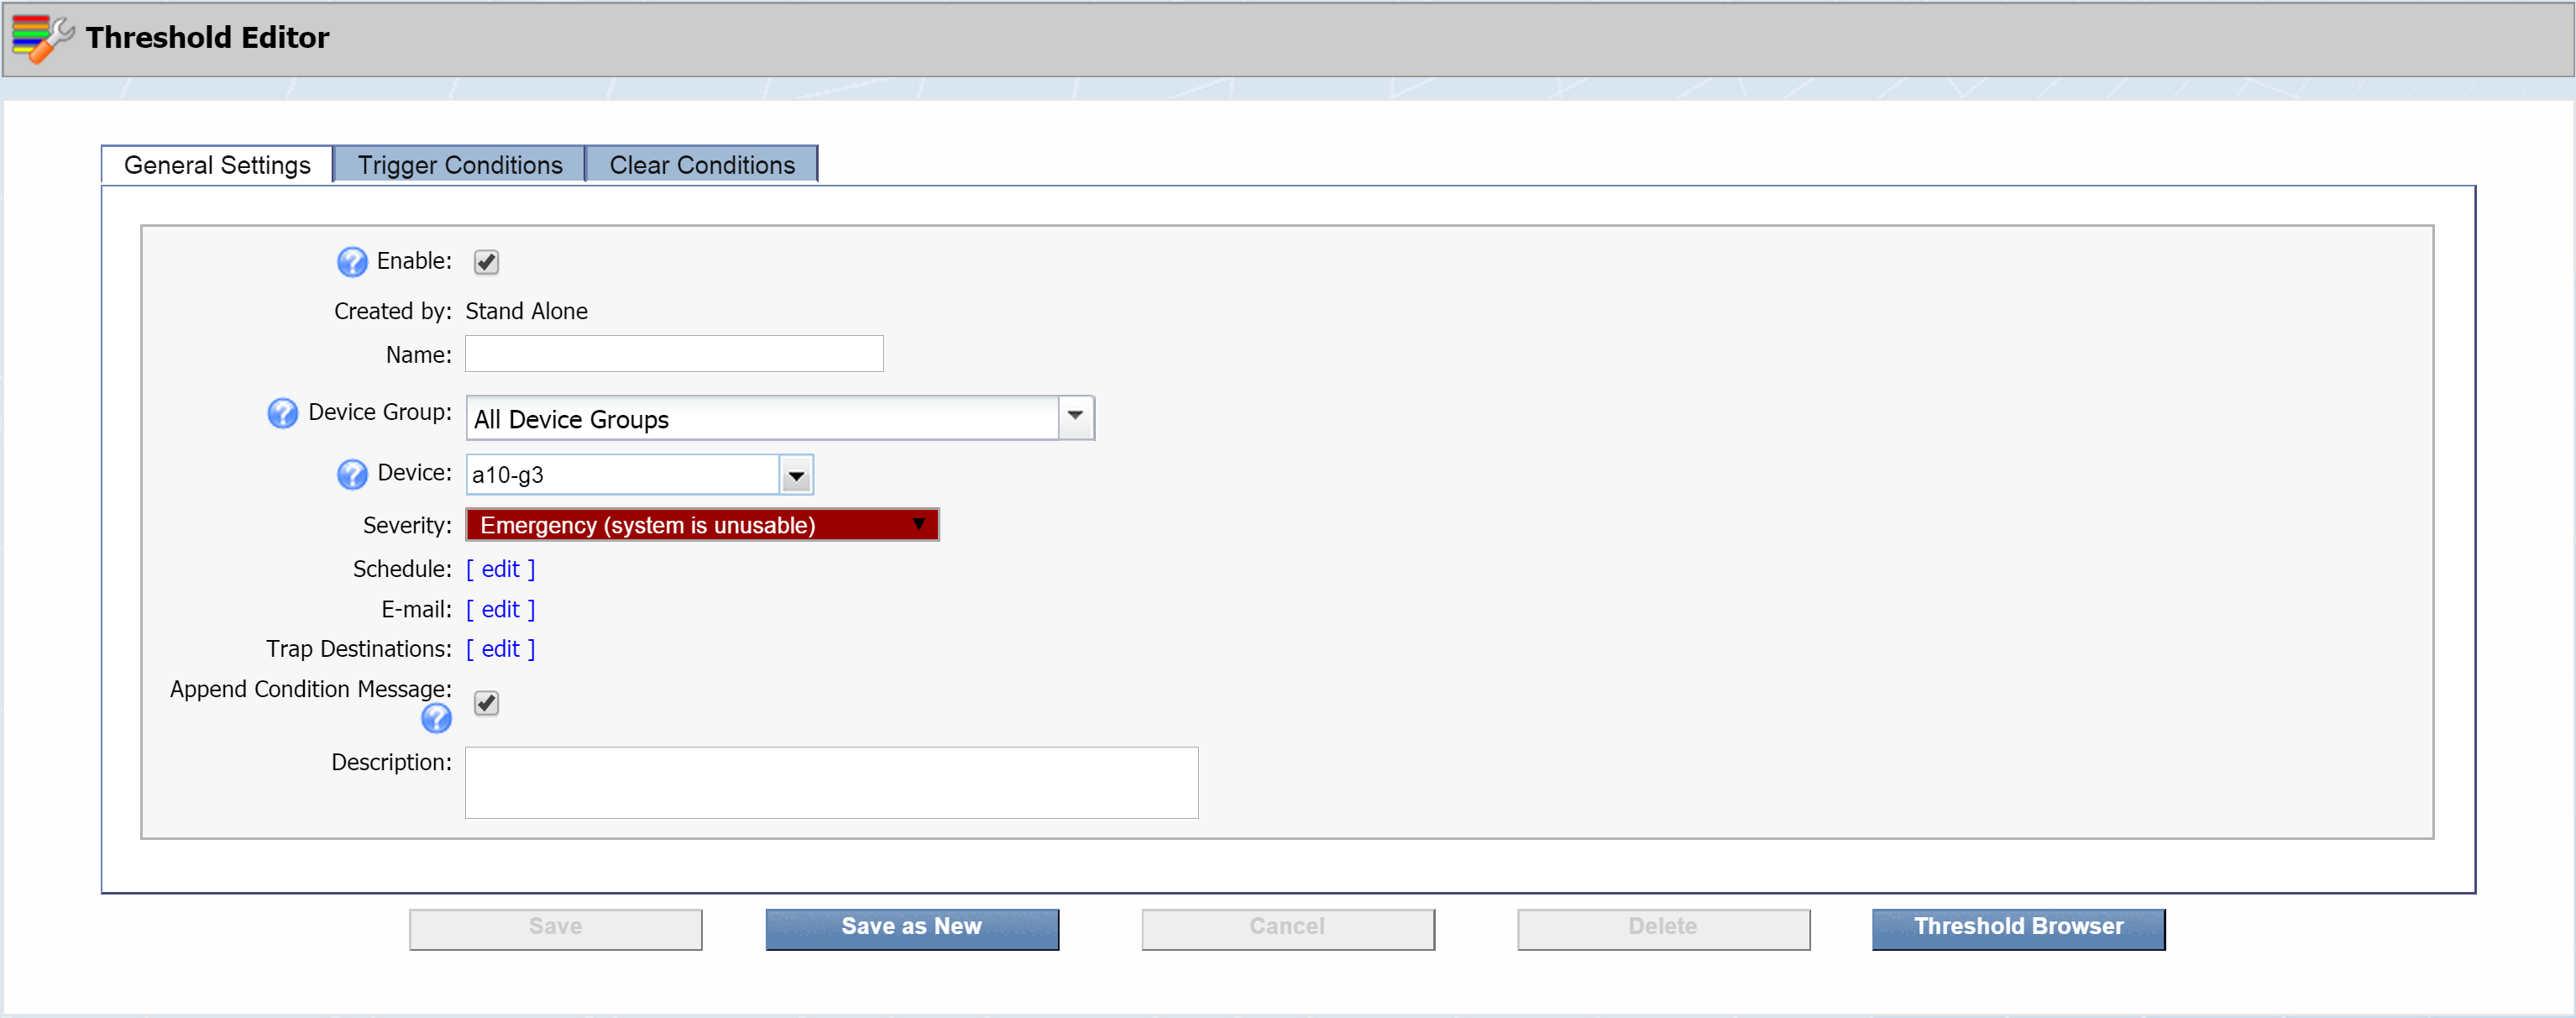
Click New Threshold to bring up the Threshold Editor. We'll start off on the General Settings tab.
-
The Enable check box is selected by default. Go ahead and leave it that way. This indicates that the threshold is active.
Disabled thresholds appear in light text on the Threshold Browser.
-
Next to Created by, you'll see Stand Alone. This indicates that the threshold is created independently of any policy.
For thresholds that were created from a policy, you would see the name of that policy after Created by. For example, if you were to look up a threshold created by our policy from the last section, you'd see Created by: SevOne_DiskUtilizationYellow. Clicking SevOne_DiskUtilizationYellow would take you directly to the policy itself.
-
In the Name field, enter the name of your threshold. For our example, we're going to call this one europa-03_IdleCPUTimeCritical. Replace europa-03 with the name of the device that your threshold applies to .
-
Click the Device Group drop-down and select the device group that the device belongs to. Under All Device Groups, click + next to Manufacturer and select SevOne. If your device belongs to a different device group, select that device group instead.
-
Click the Device drop-down and select the device that this threshold applies to. For our example, we've selected europa-03.
-
Click the Severity drop-down to select a severity level to display on the Alerts page when the threshold triggers an alert. Select Critical (critical condition).
-
Leave the Schedule field as it is, so that the alert engine will run every three minutes to retest the thresholds.
-
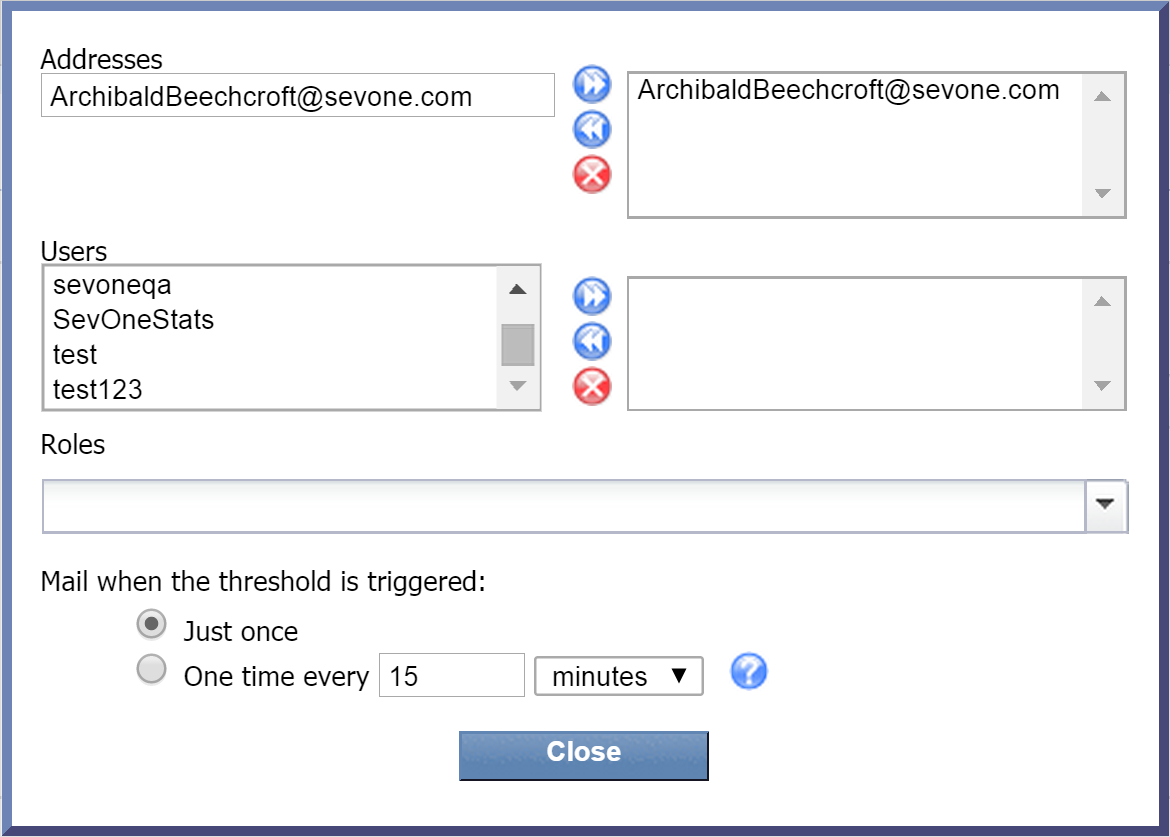
Next to E-mail, click edit to display a pop-up that lets you specify who should receive email when the policy triggers an alert. You have three options here, and they're not mutually exclusive:
-
Addresses - manually enter one or more email addresses. Once you've entered an email address, click
 to add it. Email addresses that you've added will appear in the column on the right.
 -
Users - select one or more users from the Users list and click
 to add your selection(s).
 -
Roles - click the Roles drop-down and select the check box next to one or more user roles to add as recipients.
Now click Close.
-
-
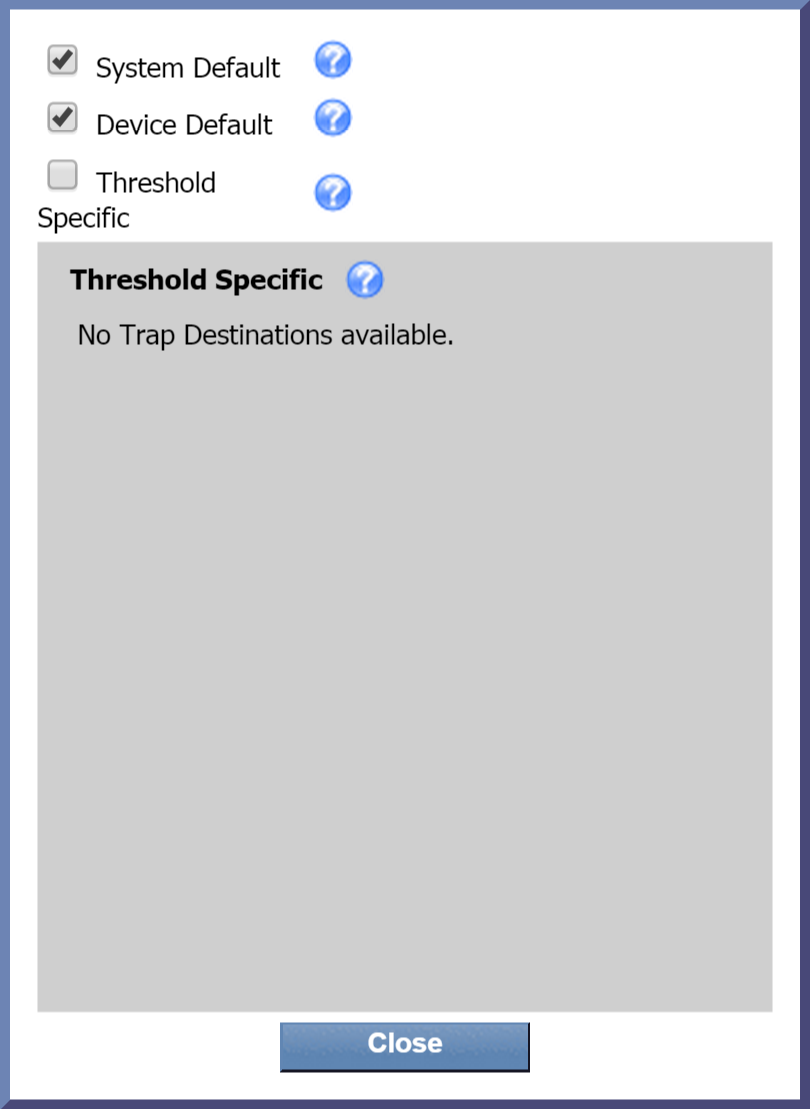
Next to Trap Destinations, click edit to display a pop-up that lets you specify where to send traps from the policy. By default, the first two check boxes are selected. Just leave this as it is. Now click Close.
-
The Append Condition Message check box is selected by default. Go ahead and leave it selected.
-
In the Description field, enter a description of the policy. For our example, let's say Triggers if europa-03 CPU idle time falls below 20%.
Trigger Conditions tab
This is where you can define the conditions to trigger the threshold. You'll also be able to create a trigger message and condition messages.
-
Select the Trigger Conditions tab. Next to Device, you'll see the device that you specified on the General Settings tab.

-
In the Trigger Message field, enter the message that you want to display for this threshold on the Alerts page. For this one, we'll say CPU idle time on europa-03 is critically low . Feel free to modify the message to suit your needs.
-
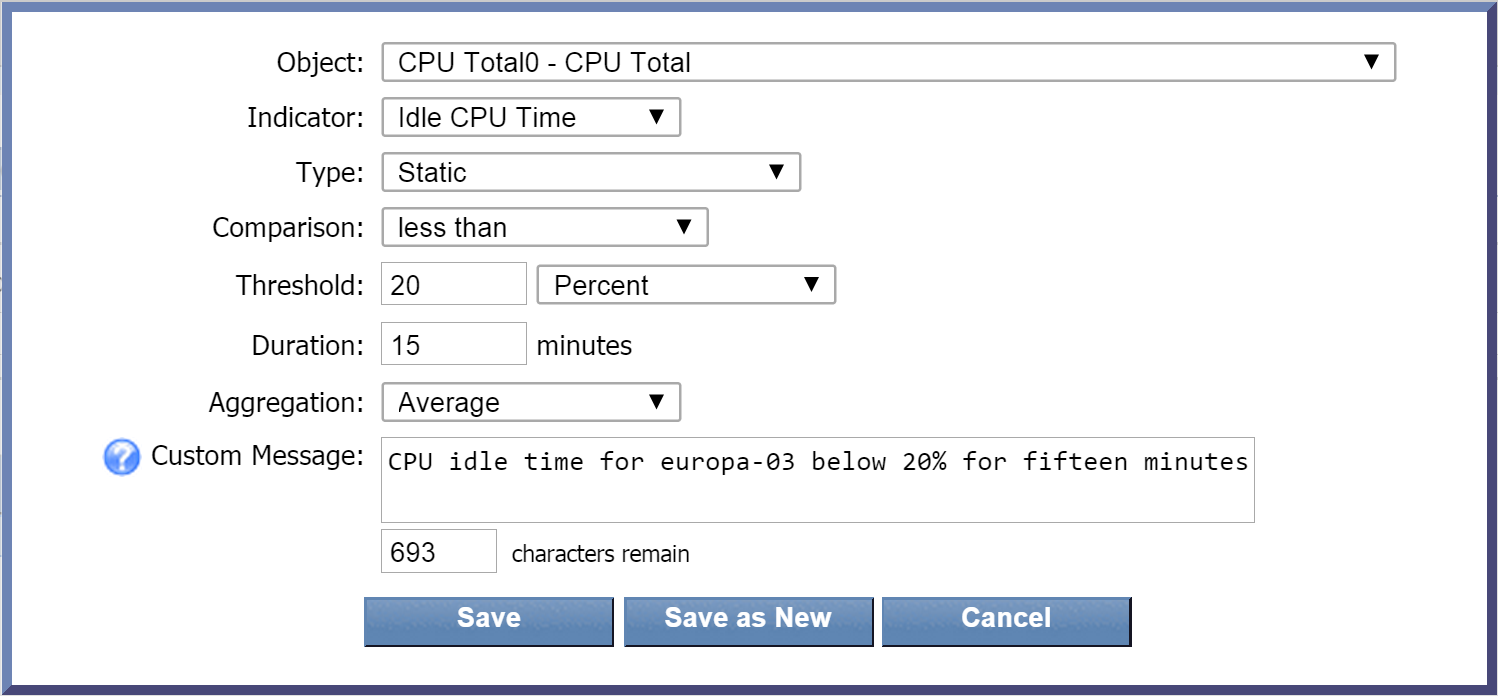
Under Conditions, click
 and select Create New. Perform the following actions to define your new condition.
-
Click the Object drop-down and select an object to base the condition on. For this condition, we're going to scroll down to the SNMP Poller section and select CPU Total0 - CPU Total .
-
Click the Indicator drop-down and select an indicator to base the condition on. Let's select Idle CPU Time.
-
The Type drop-down is set to Static by default. Leave it as it is. This will compare the current indicator value to the indicator value that you define.
-
Click the Comparison drop-down and select less than as the comparison operator.
-
In the Threshold field, enter 20 as the value to trigger the condition.
-
Now click the drop-down to the right of the Threshold field and select Percent as the unit of measure for the threshold.
-
In the Duration field, enter 15 as the number of minutes for the condition to be met before triggering an alert. This means that if the CPU idle time is lower than 20% for 15 minutes, the condition will trigger an alert.
-
Leave the Aggregation drop-down set to the default data aggregation method, Average.
-
In the Custom Message field, you can enter a message specific to this condition. For this one, we'll say CPU idle time for europa-03 below 20% for fifteen minutes. Since we've specified that we want custom messages appended to the trigger message, this condition message will append to our trigger message.
-
Now click Save.

-
Clear Conditions tab
This is where you can define the conditions to clear the alert. If you don't define a clear condition, then the alerts triggered by the trigger condition will display on the Alerts page until you manually acknowledge them. In the following steps, we're going to define a clear condition to clear the triggered alert (defined on the Trigger Conditions tab) once the CPU idle time is more than 40% for fifteen minutes.
-
Select the Clear Conditions tab.

-
In the Clear Message field, enter a message to display when the alert has been cleared.
-
Under Conditions, click
 and select Create New. Perform the following actions to define your new condition.
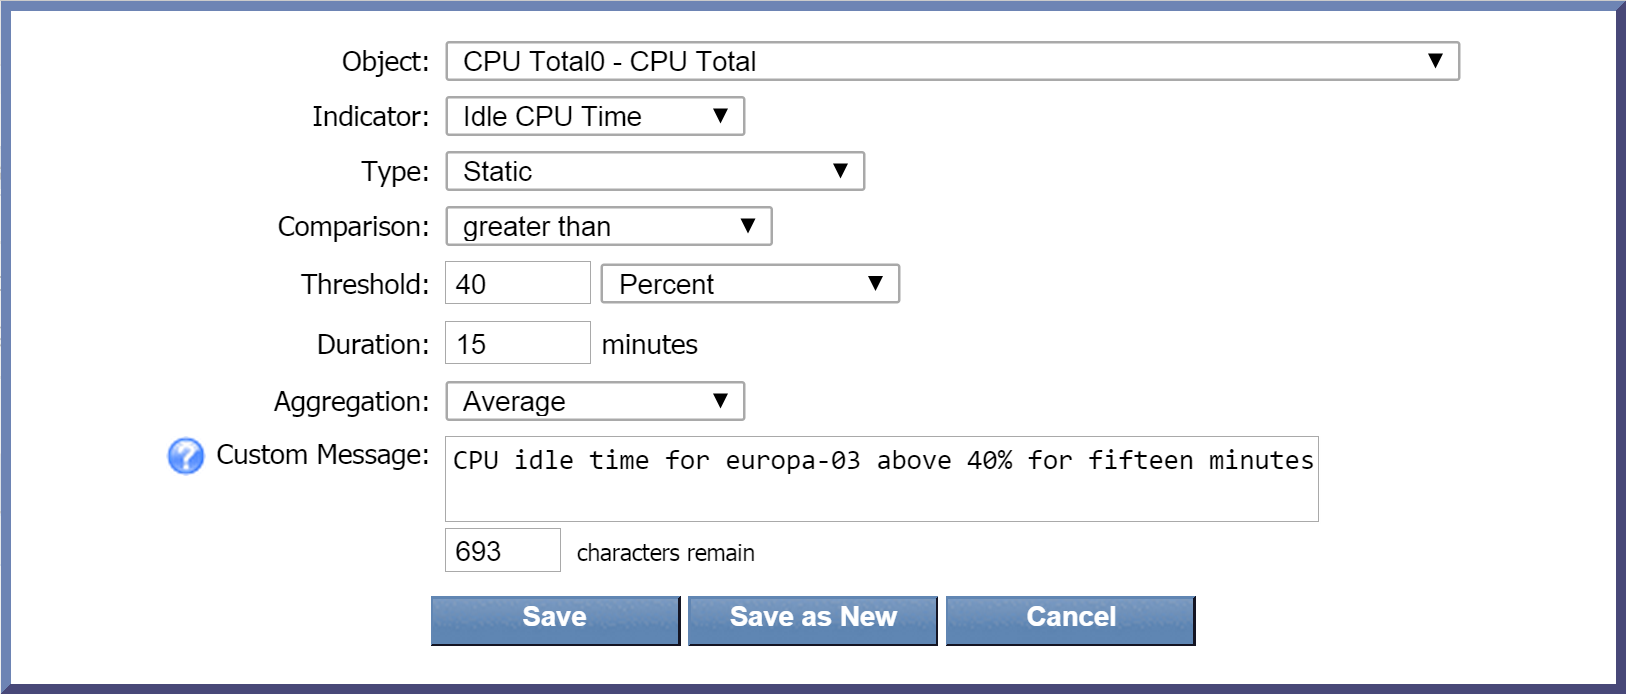
-
Click the Object drop-down and select an object to base the condition on. Scroll down to the SNMP Poller section and select CPU Total0 - CPU Total.
-
Click the Indicator drop-down and select Idle CPU Time as our indicator to base the condition on.
-
The Type drop-down is set to Static by default. Leave this as it is.
-
Click the Comparison drop-down and select greater than as the comparison operator.
-
In the Threshold field, enter 40 as the value to trigger the condition.
-
Now click the drop-down to the right of the Threshold field and select Percent as the unit of measure for the threshold.
-
In the Duration field, enter 15 as the number of minutes for the condition to be met before the alert can be cleared.
-
Leave the Aggregation drop-down set to the default data aggregation method, Average.
-
In the Custom Message field, you can enter a message specific to this condition. For this one, let's say CPU idle time for europa-03 above 40% for fifteen minutes.
-
Now click Save.

-
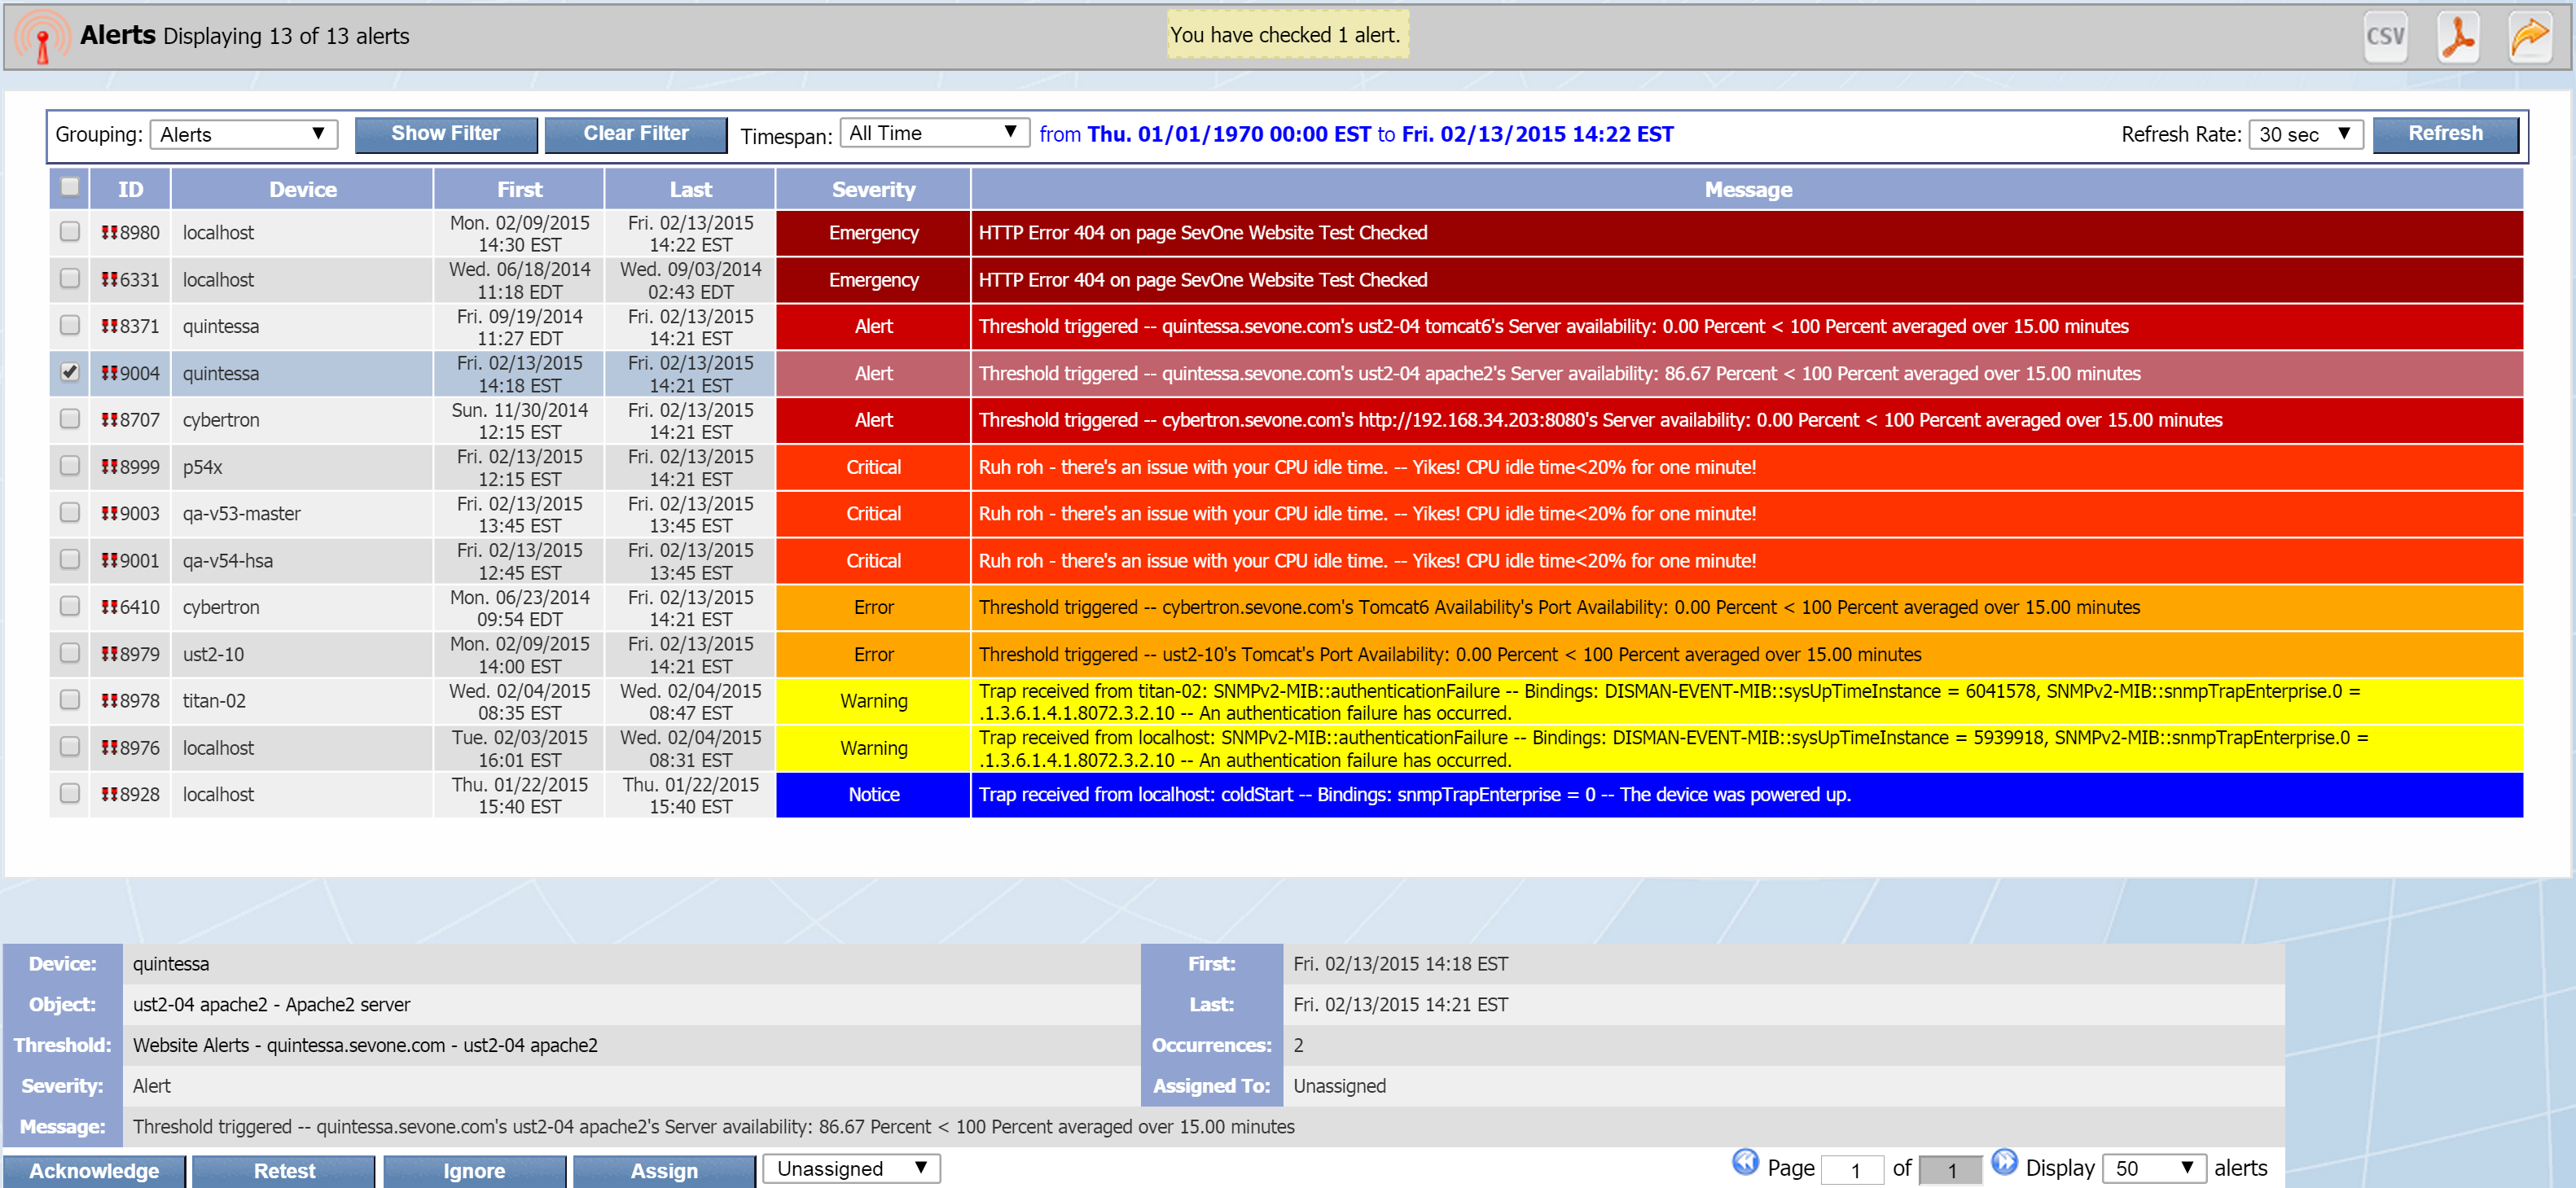
Alerts
The Alerts page lets you look at the current, active alerts in the system. These include the threshold violations, trap notifications, and web site errors that you define on the Policy Browser or the Threshold Browser.
To access the Alerts page from the navigation bar, click Events and select Alerts.
Filters
The Alerts page features filters, which you can use to focus the display results. For example, if you only want to look at Critical alerts, you can easily specify a severity level of Critical on the General tab. If you wanted to narrow your focus a little more, you could also specify a device group–such as the SevOne device group we talked about earlier–on the Device Groups tab. Filters are cumulative. This means that the display results would include only devices that have Critical alerts and belong to the SevOne device group.
Filters are optional. You can maximize the display results by clearing the filters. Following is an overview of the four filter tabs. After making any changes on a tab, click Apply Filter to apply your filter settings for that tab.
Click Show Filter at the top of the Alerts page to see the filter tabs.
General tab

The General tab includes the following filters:
-
Severity - lets you specify the severity level of the display results. By default, all severity levels are selected.
-
Message - lets you filter results based on the message text.
-
Assigned - lets you filter results based on the person or role that the alert is assigned to . Earlier, when we set up a policy and a threshold, we had the option of specifying someone to receive email when an alert triggers. This is what Assigned refers to.
-
Search ID - lets you filter results based on either the Alert ID, the Threshold ID, or the Policy ID.
-
Show - lets you choose whether to view active alerts, alerts that have been ignored, or both.
Devices tab

The Devices tab lets you specify one or more devices to filter the display results by. Click the drop-down and select the device(s) that you'd like to add to the filter.
Device Groups tab

The Device Groups tab lets you specify one or more device group(s) to filter the display results by. Click the drop-down and select the check box next to each device group that you'd like to include.
Object Groups tab

The Object Groups tab lets you filter display results based on one or more specific object groups. Select the object group(s) that you'd like to add to the filter. Once you've made your selection, click  to add them. Object groups that you've added will appear in the column on the right.
Grouping
Just below the filters area, you'll see the Grouping drop-down. The Grouping option lets you display different levels of granularity. There are four possible Grouping settings, with Alerts being the most granular.
Below is a description of each Grouping setting. Click the Grouping drop-down to select any of the four settings.
Grouping: Alerts

The Alerts grouping setting is set as the default for the Alerts page and displays the following columns:
-
ID - the ID number for the Alert. An ID preceded by
 is unassigned.
  , on the other hand, indicates that the alert is assigned.
 -
Device - the name of the device that triggered the alert.
-
First - the date and time that the alert was first reported to SevOne NMS.
-
Last - the date and time that the alert was last reported.
-
Severity - the severity level of the alert.
-
Message - the message generated by the threshold or trap.
Alerts - Controls

When you choose the Alerts Grouping, you'll see several controls at the bottom of the page. You can use these to view alert details and manage alerts. To see the controls for a specific alert, select the check box for that alert. The following is an overview of the available controls.
-
Device - the device that triggered the alert. Click the device name to display a link to the Device Summary as well as to the report templates for the device.
-
Object - the object that triggered the alert. Click the object name to display a link to the Object Summary as well as to the report templates for the object.
-
Threshold or Trap - the threshold or trap that triggered the alert. Click the threshold name or trap event name to go to the Threshold Editor or Trap Event Editor.
-
Severity - the severity level of the alert.
-
Message - the message generated by the threshold or trap.
-
First - the date and time that the alert was first reported.
-
Last - the date and time that the alert was last reported.
-
Occurrences - the total number of times that the alert triggered.
The alert engine runs every three minutes. A policy-based threshold requires ten minutes to gather enough data to trigger an alert. This means that it can take up to thirteen minutes for the first alert for a new policy to appear.
-
Assigned To - the name of the person or role that the alert is assigned to. By default, alerts are unassigned.
-
Log Analytics - a field that appears if your cluster has a Performance Log Appliance (PLA). Click the Check for device logs link to display log data related to the alert.
Alerts - Actions

At the bottom of the page, just below the controls, you'll see four buttons. With the Alerts grouping setting, there are four actions that you can apply to an alert. The following is an overview of those actions. Select the check box next to an alert and do one (or more) of the following:
-
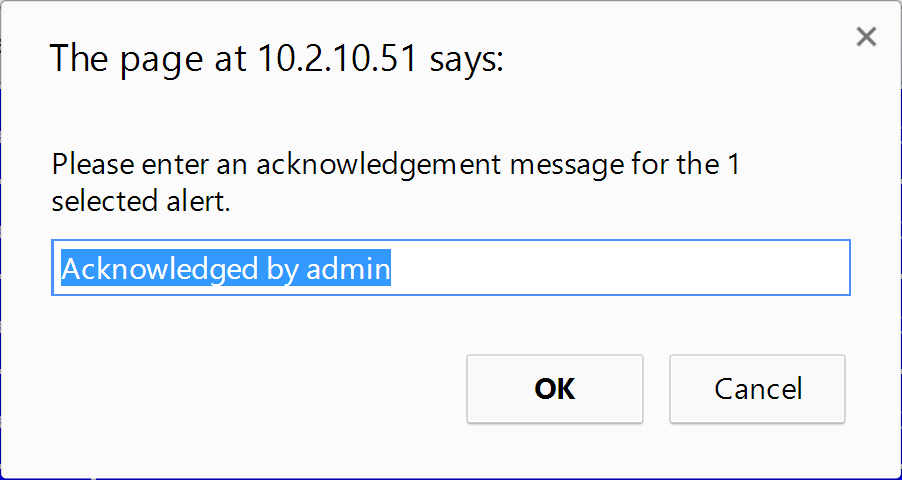
Click Acknowledge to acknowledge the alert. Once an alert has been acknowledged, it's permanently moved to the Alert Archive. When you acknowledge an alert, you'll see a pop-up where you can enter an explanation for the acknowledgement.
-
Click Retest to see if the threshold trigger condition still exists for the alert. The alert engine retests all thresholds every three minutes.
A couple notes about alerts triggered by thresholds without clear conditions:
-
They'll remain on the Alerts page until they're acknowledged.
-
When you retest them–even if the trigger condition is no longer met–they'll continue to display on the Alerts page, but the last date and time information won't change.
-
-
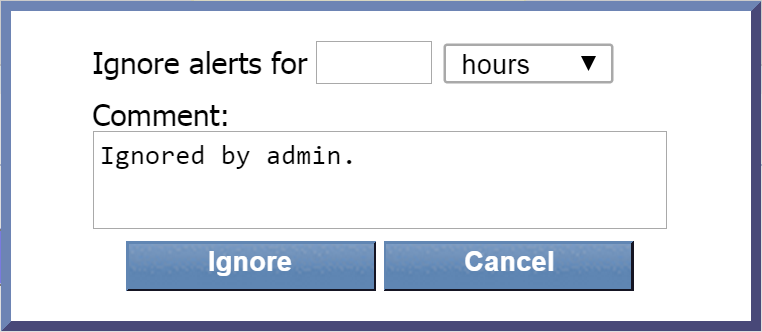
Click Ignore to ignore the alert. When you ignore an alert, you'll see a pop-up where you can specify how long you would like to ignore the alert. You can also enter a note.
-
Click Assign to assign the alert to someone. Then click the drop-down next to Assign to select a person or a role.
Grouping: Devices

The Devices grouping setting displays the following columns:
-
Device - the name of the device that triggered the alert.
-
First - the date and time that the first alert for the device was first reported.
-
Last - the date and time that the last alert for the device was last reported.
-
Highest Severity - the highest severity level of the alerts for the device.
-
Message - information about the total number of alerts triggered by the device along with the highest severity level of the alerts for the device.
To view the alerts for a device, click either the device name or the device message. Clicking either one will apply the Alerts grouping setting to that specific device.
Grouping: Device Groups

The Device Groups grouping setting displays the following columns:
-
Device Group - the name of the device group or device type that triggered alerts.
-
First - the date and time that the first alert for the device group/device type was first reported.
-
Last - the date and time that the last alert for the device group/device type was last reported.
-
Highest Severity - the highest severity level of the alerts for the device group/device type.
-
Message - information about the total number of alerts triggered by the device group/device type along with the highest severity level of the alerts for the device group/device type.
Click any device group/device type name or message to view the devices belonging to that group/type along with the alerts for those devices. This will apply the Devices grouping setting to that specific device group/device type.
Grouping: Object Groups

The Object Groups grouping setting displays the following columns:
-
Object Group - the name of the object group that triggered alerts.
-
First - the date and time that the first alert for the object group was first reported.
-
Last - the date and time that the last alert for the object group was last reported.
-
Highest Severity - the highest severity level of the alerts for the object group.
-
Message - information about the total number of alerts triggered by the object group along with the highest severity level of the alerts for the object group.
Click any object group name or message to view the devices associated with that object group along with the alerts for those devices. This will apply the Alerts grouping setting to that specific object group.
Instant Graphs
On the Instant Graphs page, you can create statistical graphs for the objects and indicators on devices. This is a great place to start because instant graphs are very easy and fast to set up, allowing you to get an immediate look at potential problem areas.
In this section we're going to look at CPU activity for the past 24 hours.
To access the Instant Graphs page from the navigation bar, click Reports and select Instant Graphs.
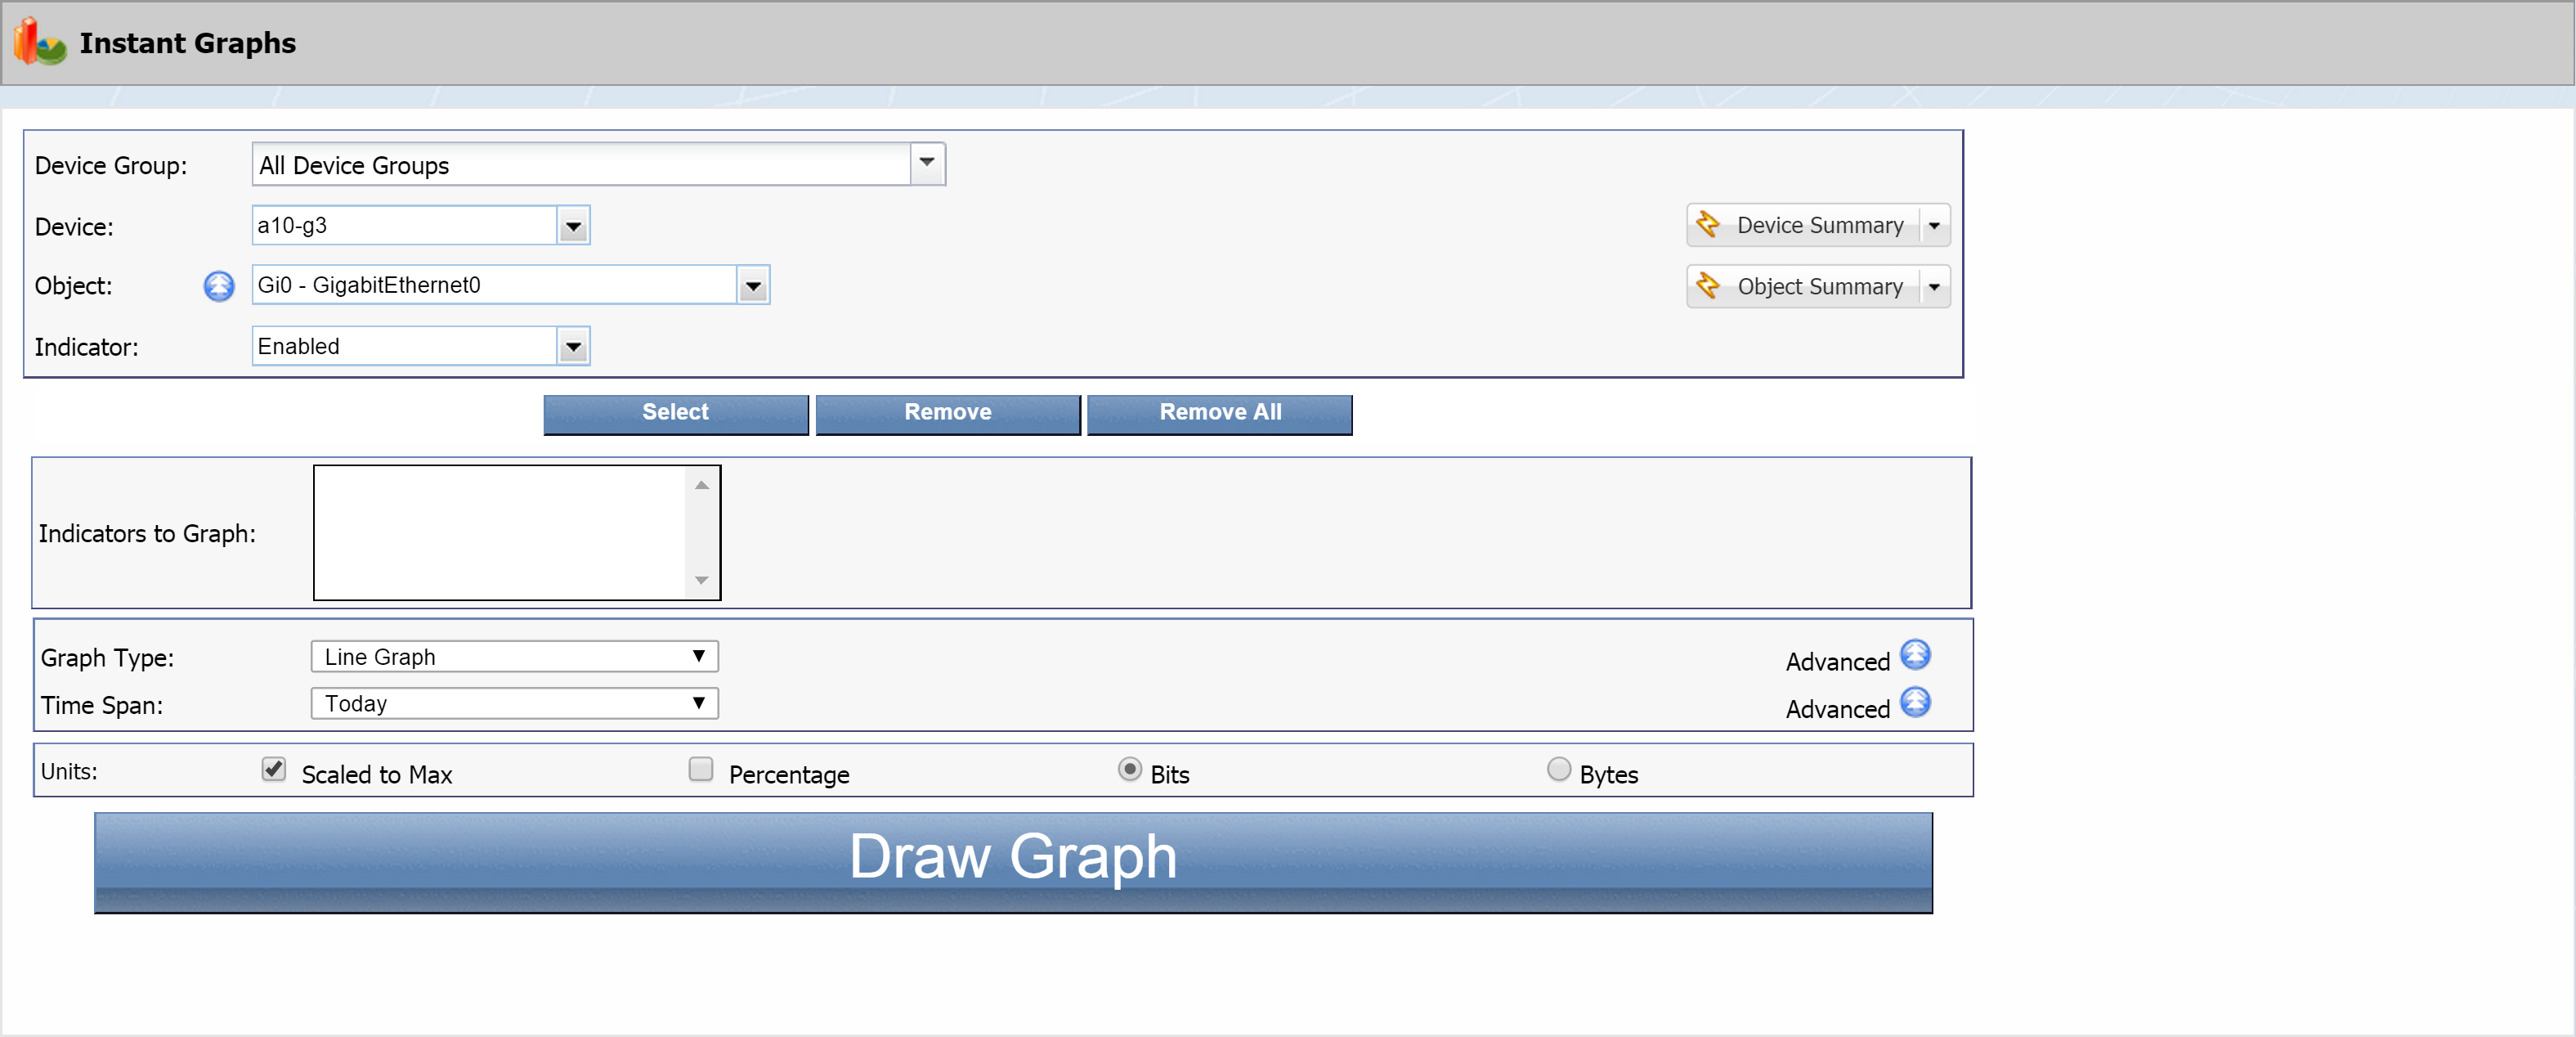
-
Click the Device Group drop-down to select a device group. We're going to select the SevOne device group. Under All Device Groups, click + next to Manufacturer and select SevOne.
-
Click the Device drop-down and select a device to base the instant graph on.
-
Click the Object drop-down to select an object. Let's go with CPU Total0 - CPU Total under SNMP Poller.
-
Click the Indicator drop-down to select an indicator. Select Idle CPU Time.
-
Click the Select button. This will move the indicator you selected to the Indicators to Graph field.
-
Let's throw in one more indicator. Click the Indicator drop-down and select Waiting CPU Time. Then click the Select button to add it.
-
Now you should see both indicators in the Indicators to Graph field. You'll notice that each is preceded by the device name and the object name.

We just added two indicators from the same device and object. You can also add indicators from other devices and objects to display everything in a single graph.
-
The Graph Type is set to Line Graph by default. Let's go with that.
-
Click the Time Span drop-down and select Past 24 hours.
-
In the Units section, the Scaled to Max check box is selected by default. Just leave it that way. This means that the graph will be scaled to the largest actual value for the specified time span. Clearing the check box scales the graph to the maximum potential value. The Scaled to Max setting is irrelevant for indicators that don't have a defined maximum value.
-
Leave the Percentage check box clear for our example.
-
You'll notice two radio buttons, Bits and Bytes. Select Bytes. Bits is used for network-oriented data, while Bytes applies to server-oriented data.
-
Click the Draw Graph button to display a graph of your selected indicators. The graph will appear below the button .
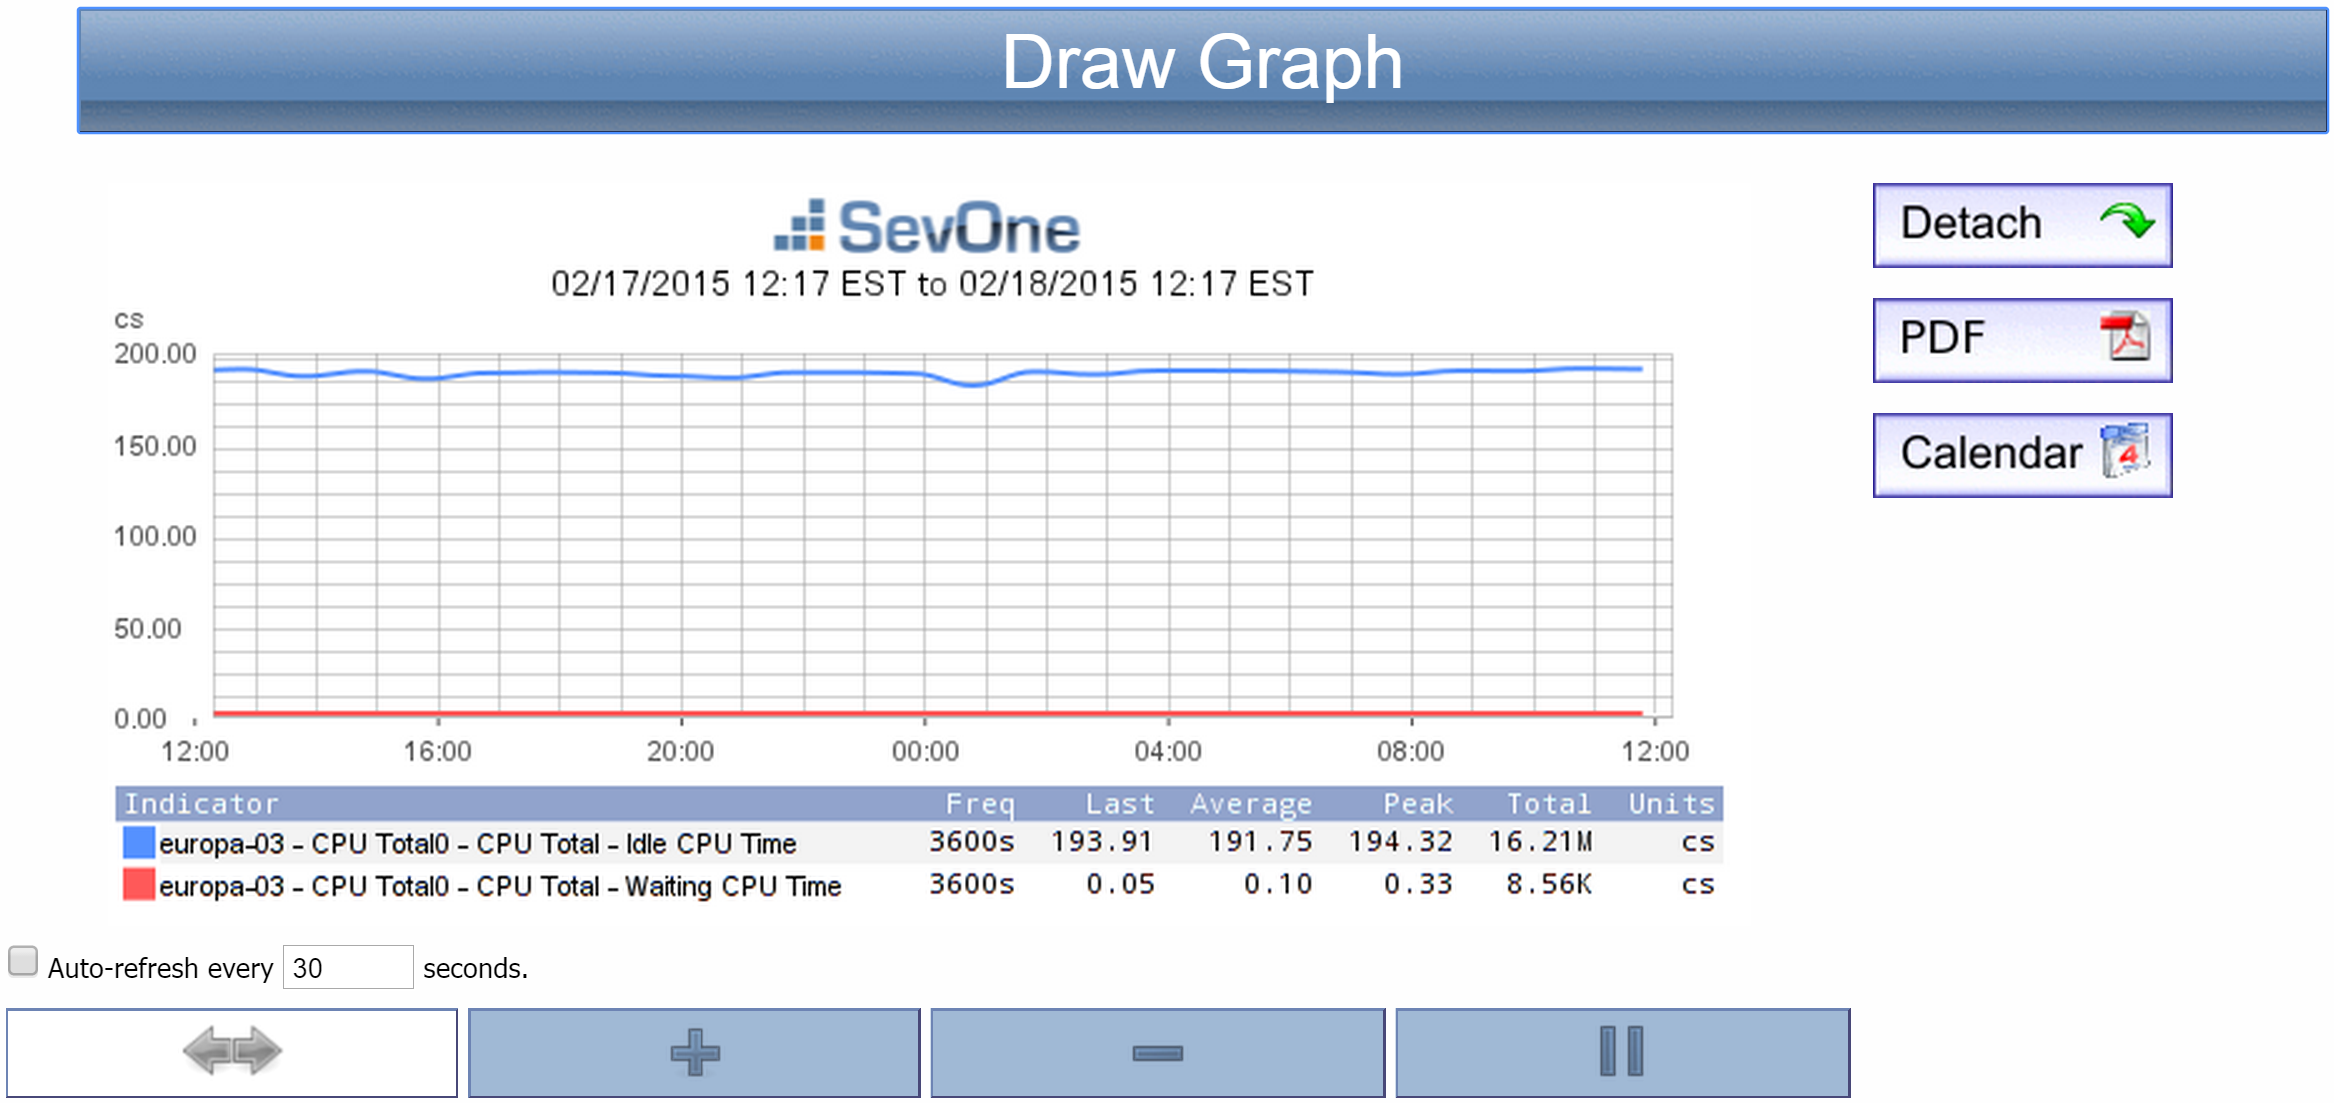
-
Your new graph comes with the following controls, which you can use to manipulate the graph presentation:
-
Auto-refresh every __ seconds check box - refreshes the graph every <n> seconds. Enter the number of seconds in the text field.
-
 - re-centers the graph. Click this icon and then click the point of the graph that you would like to be in the center. For example, if you were to click 8:00 on the graph in the screenshot above, the 8:00 point would move to the center.
-
 - zooms in. Click this icon and then click the point on the graph where you would like to zoom in for a closer look.
 -
 - zooms out. Click this icon and then click the point on the graph from where you would like to zoom out.
 -
 - focuses in on a selected range. First, click this icon. After that, click once on the starting point of your desired range, and then click on the end point of the range. Your selected range will appear highlighted. Click anywhere within the highlighted range to view a graph of it.
 -
Detach - adds the instant graph as an attachment in a report on a new browser tab.
You can modify reports to add other attachments and you can save reports to the Report Manager. Report workflows enable you to designate reports to be your favorite reports and to define one report to appear as your custom dashboard.
-
PDF - exports the report to a .pdf format.
-
Calendar - provides a view of the indicator performance over time. You can do some neat stuff with the calendar. Try the following, for example:
-
Click the Calendar button. The calendar will appear in a new browser tab. When we set up our graph, we specified the past 24 hours as our time span. You'll notice that our new calendar covers an entire month.
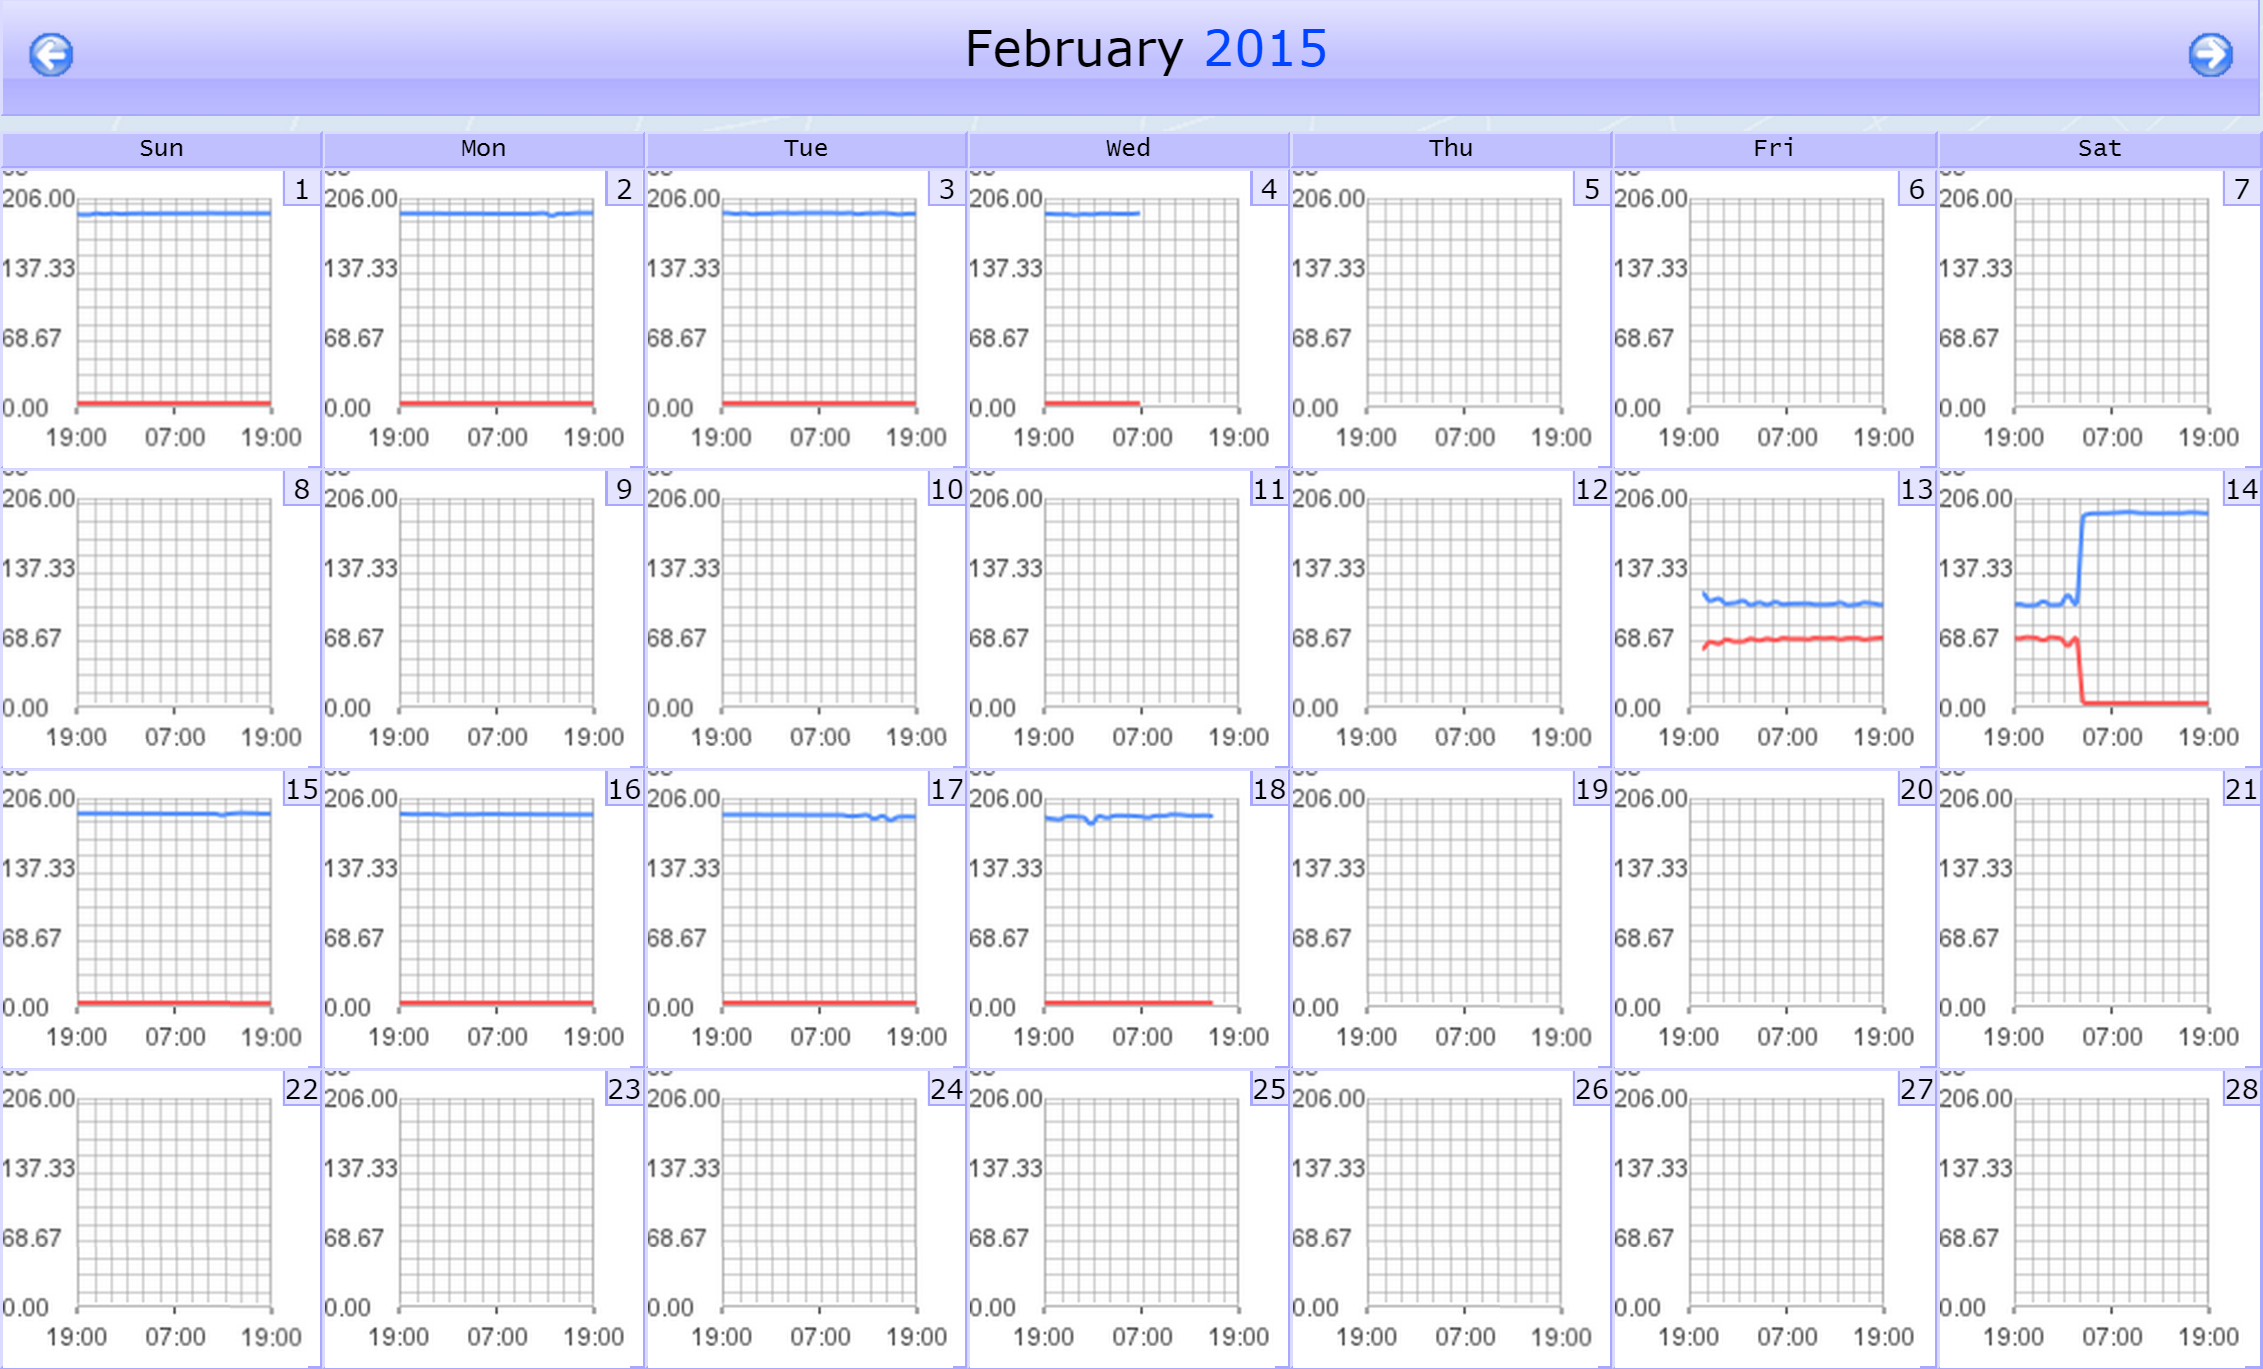
-
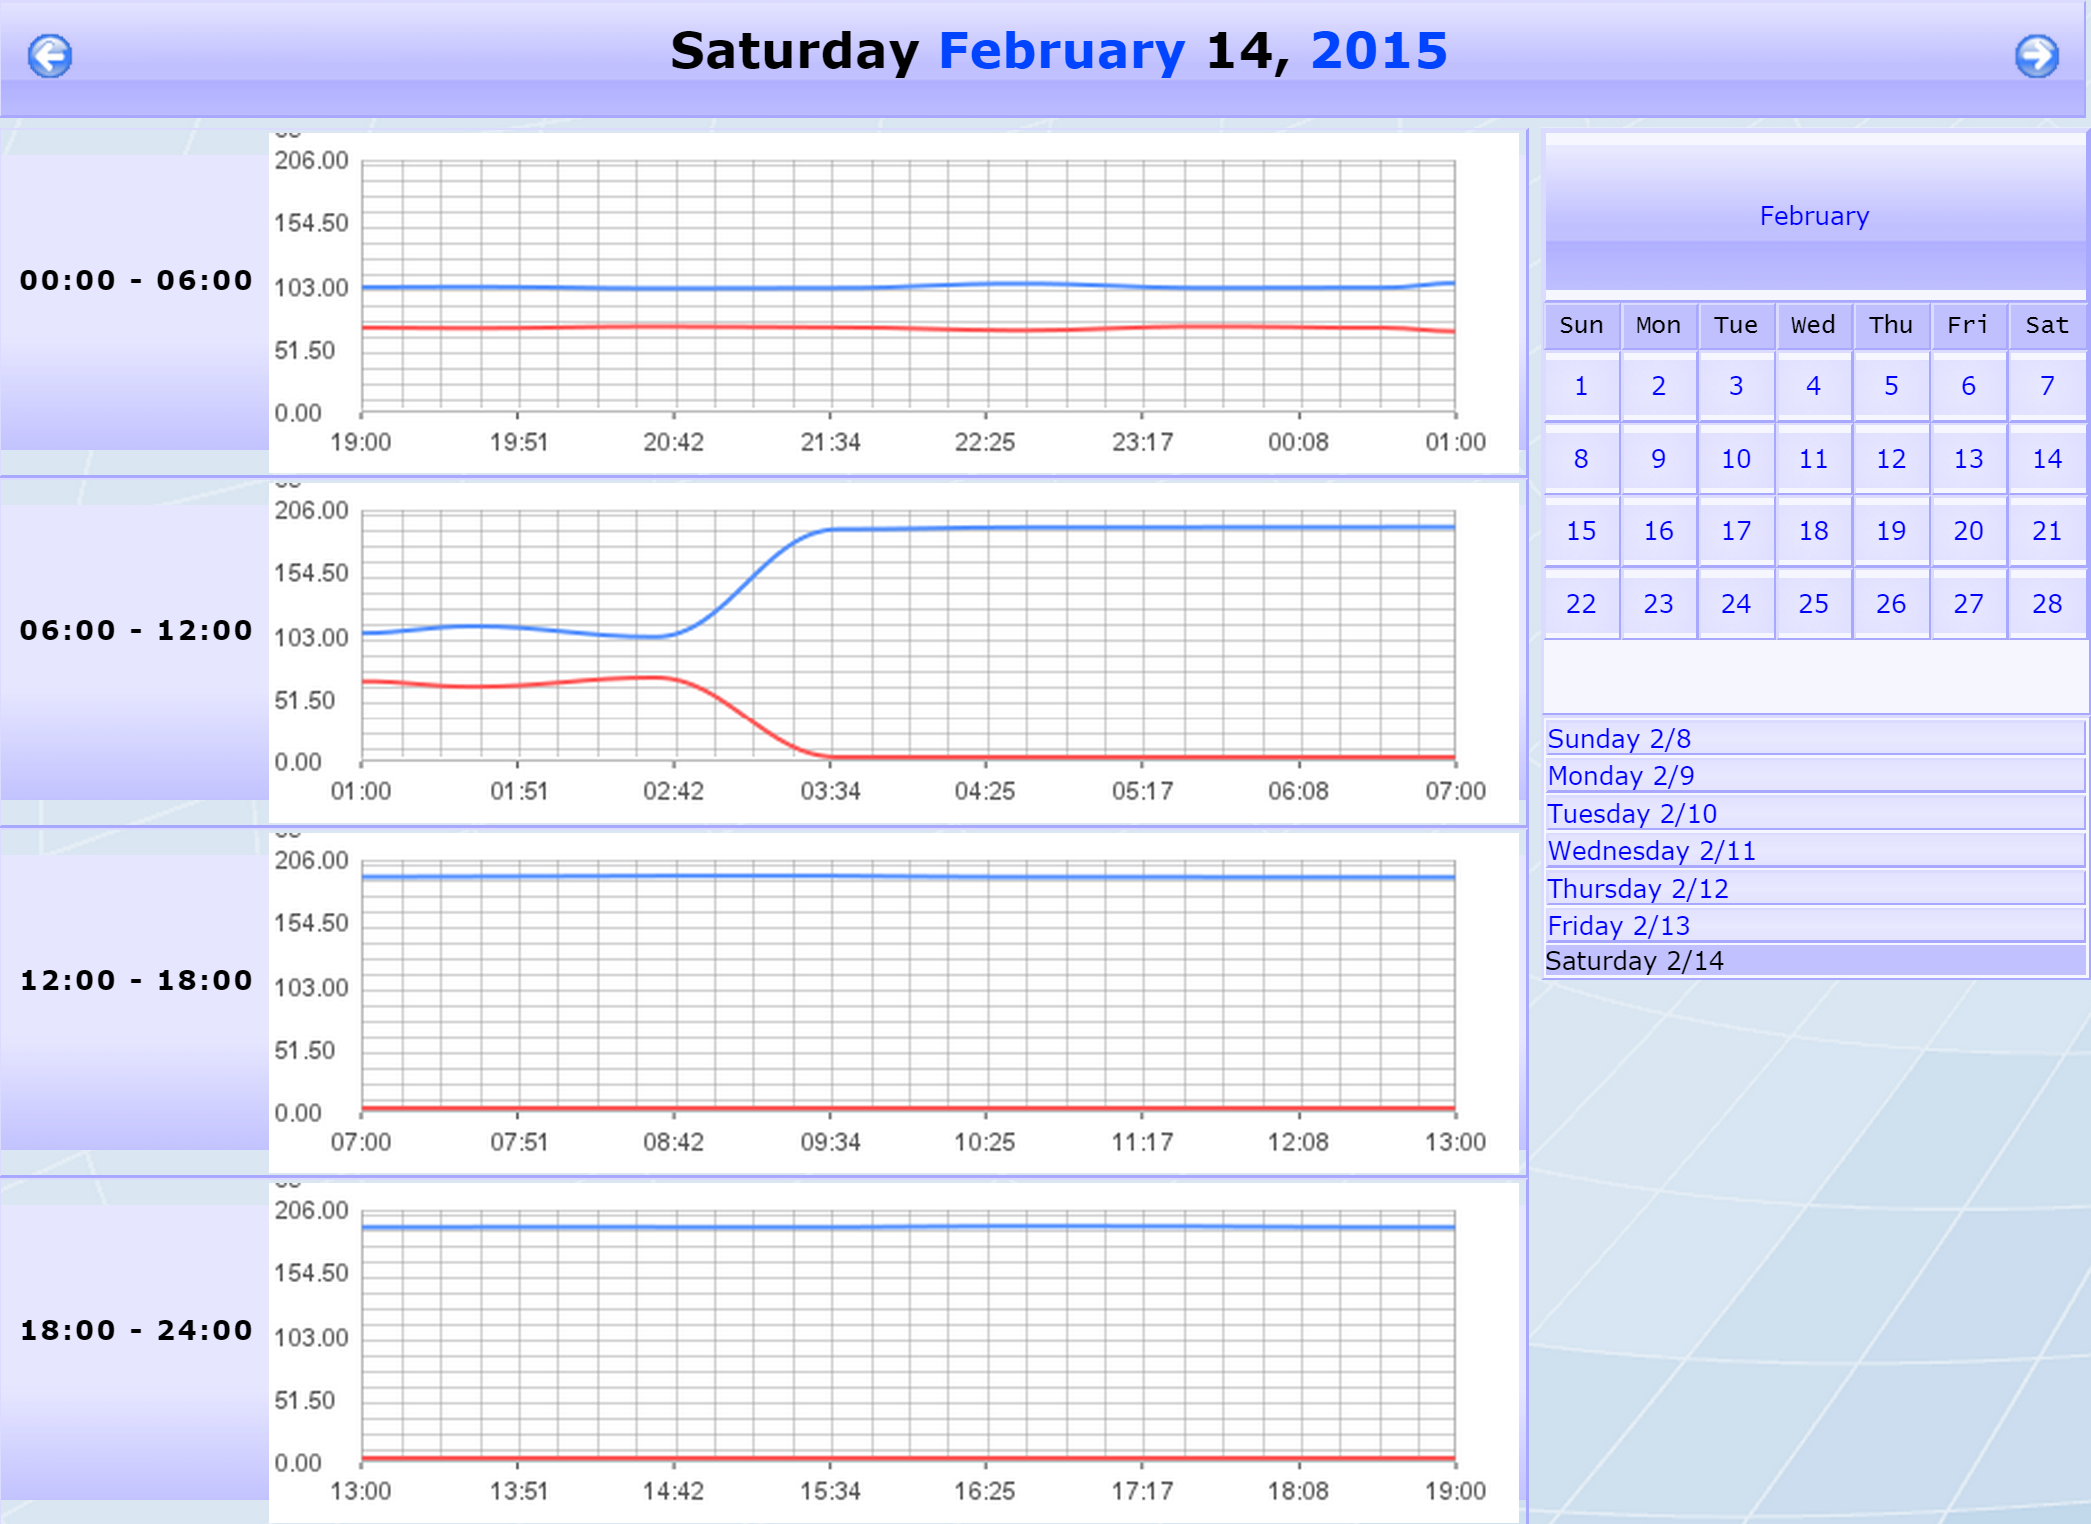
Each day on the calendar has a graph, which summarizes the indicator's activity for that day. Select a day and click the date in the upper right corner of that day.
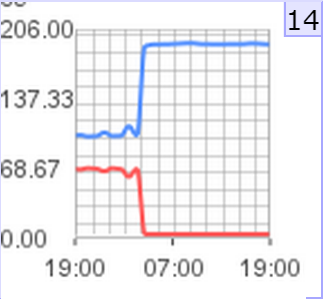
-
Now you should see a breakdown of the day's activity in the form of four six-hour graphs (from 0:00 to 24:00).
-
-
NetFlow - displays associated flow data if an indicator in the graph has mapped flow dat a. This button only appears if there is mapped flow data. When you enable the SNMP plugin for a device, many SNMP objects are automatically mapped to their corresponding flow interface, and the Object Mapping page enables you to map additional objects for flow monitoring.
-
NBAR - displays associated NBAR data if an indicator in the graph has mapped NBAR data . This button only appears if there is mapped NBAR data. You can map objects for NBAR monitoring on the Object Mapping page.
-
Recommended Policies for Self-Monitoring
The table below contains a list of SevOne recommended self-monitoring policies. You'll find the following information for each policy:
-
Policy - the name and description of the policy.
-
Plugin - the plugin you'll use for creating the policy.
-
Alert Condition - information for setting up the policy condition(s). This includes object type, severity level and the condition specifications.
-
Suggested Remediation Steps - recommended steps to take in case a condition is violated.
-
Details - any additional information.
Using the Table
The Plugin and Alert Condition columns provide the specific information that you'll need for creating each policy (see Policies and Thresholds for more information on creating policies). The following screenshot shows an example of a policy.

General Settings Tab
The Plugin column in the example above indicates that you'll need to specify Process Poller as the plugin. At the top of the Alert Conditions column, you'll find the object type that you'll need, along with the object subtype if there is one. In this example, the object type is Process, and we have an object subtype of SevOne-polld. Not all policies will require an object subtype. Immediately below the object type information is the recommended severity level, which is Alert in our example.

Trigger Conditions Tab
The Alert Condition column also contains the information you'll need for setting up your policy's trigger condition(s). This information appears below the object type and severity level information. For example, in the screenshot above, the following condition is recommended:
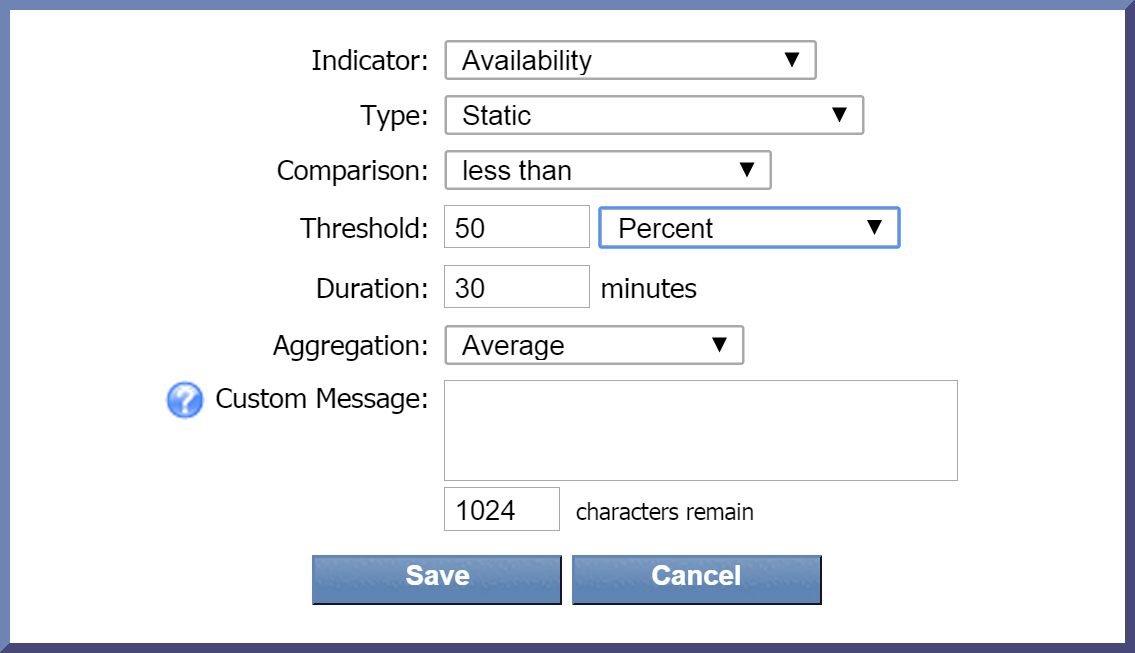
Average Availability < 50% over 30 minutes
When setting up the trigger condition, this means the following:
-
Average - specifies Average as the recommended Aggregation setting for this condition.
-
Availability - specifies Availability as the indicator to use for this condition. The indicator will appear in bold font.
-
< - specifies that the less than operator should be used for this condition.
-
50% - specifies a threshold of 50% for this condition.
-
over 30 minutes - indicates a duration of 30 minutes for the condition.
Below is a screenshot of the the pop-up where you specify the settings for your condition.
Additional Information
Type
When you create a condition for a policy, the Type drop-down is set to Static by default. For most of the conditions in the table, this is what you'll need. A few conditions will require a different Type (for example, Baseline Delta, Baseline Percentage, etc.). These exceptions are noted in the Alert Condition column.
Multiple Conditions
Some policies include more than one condition. In cases where both (or all) conditions must be met, this will be indicated by the AND Boolean operator. In the following screenshot, both of the conditions listed under Alert Condition must be met.

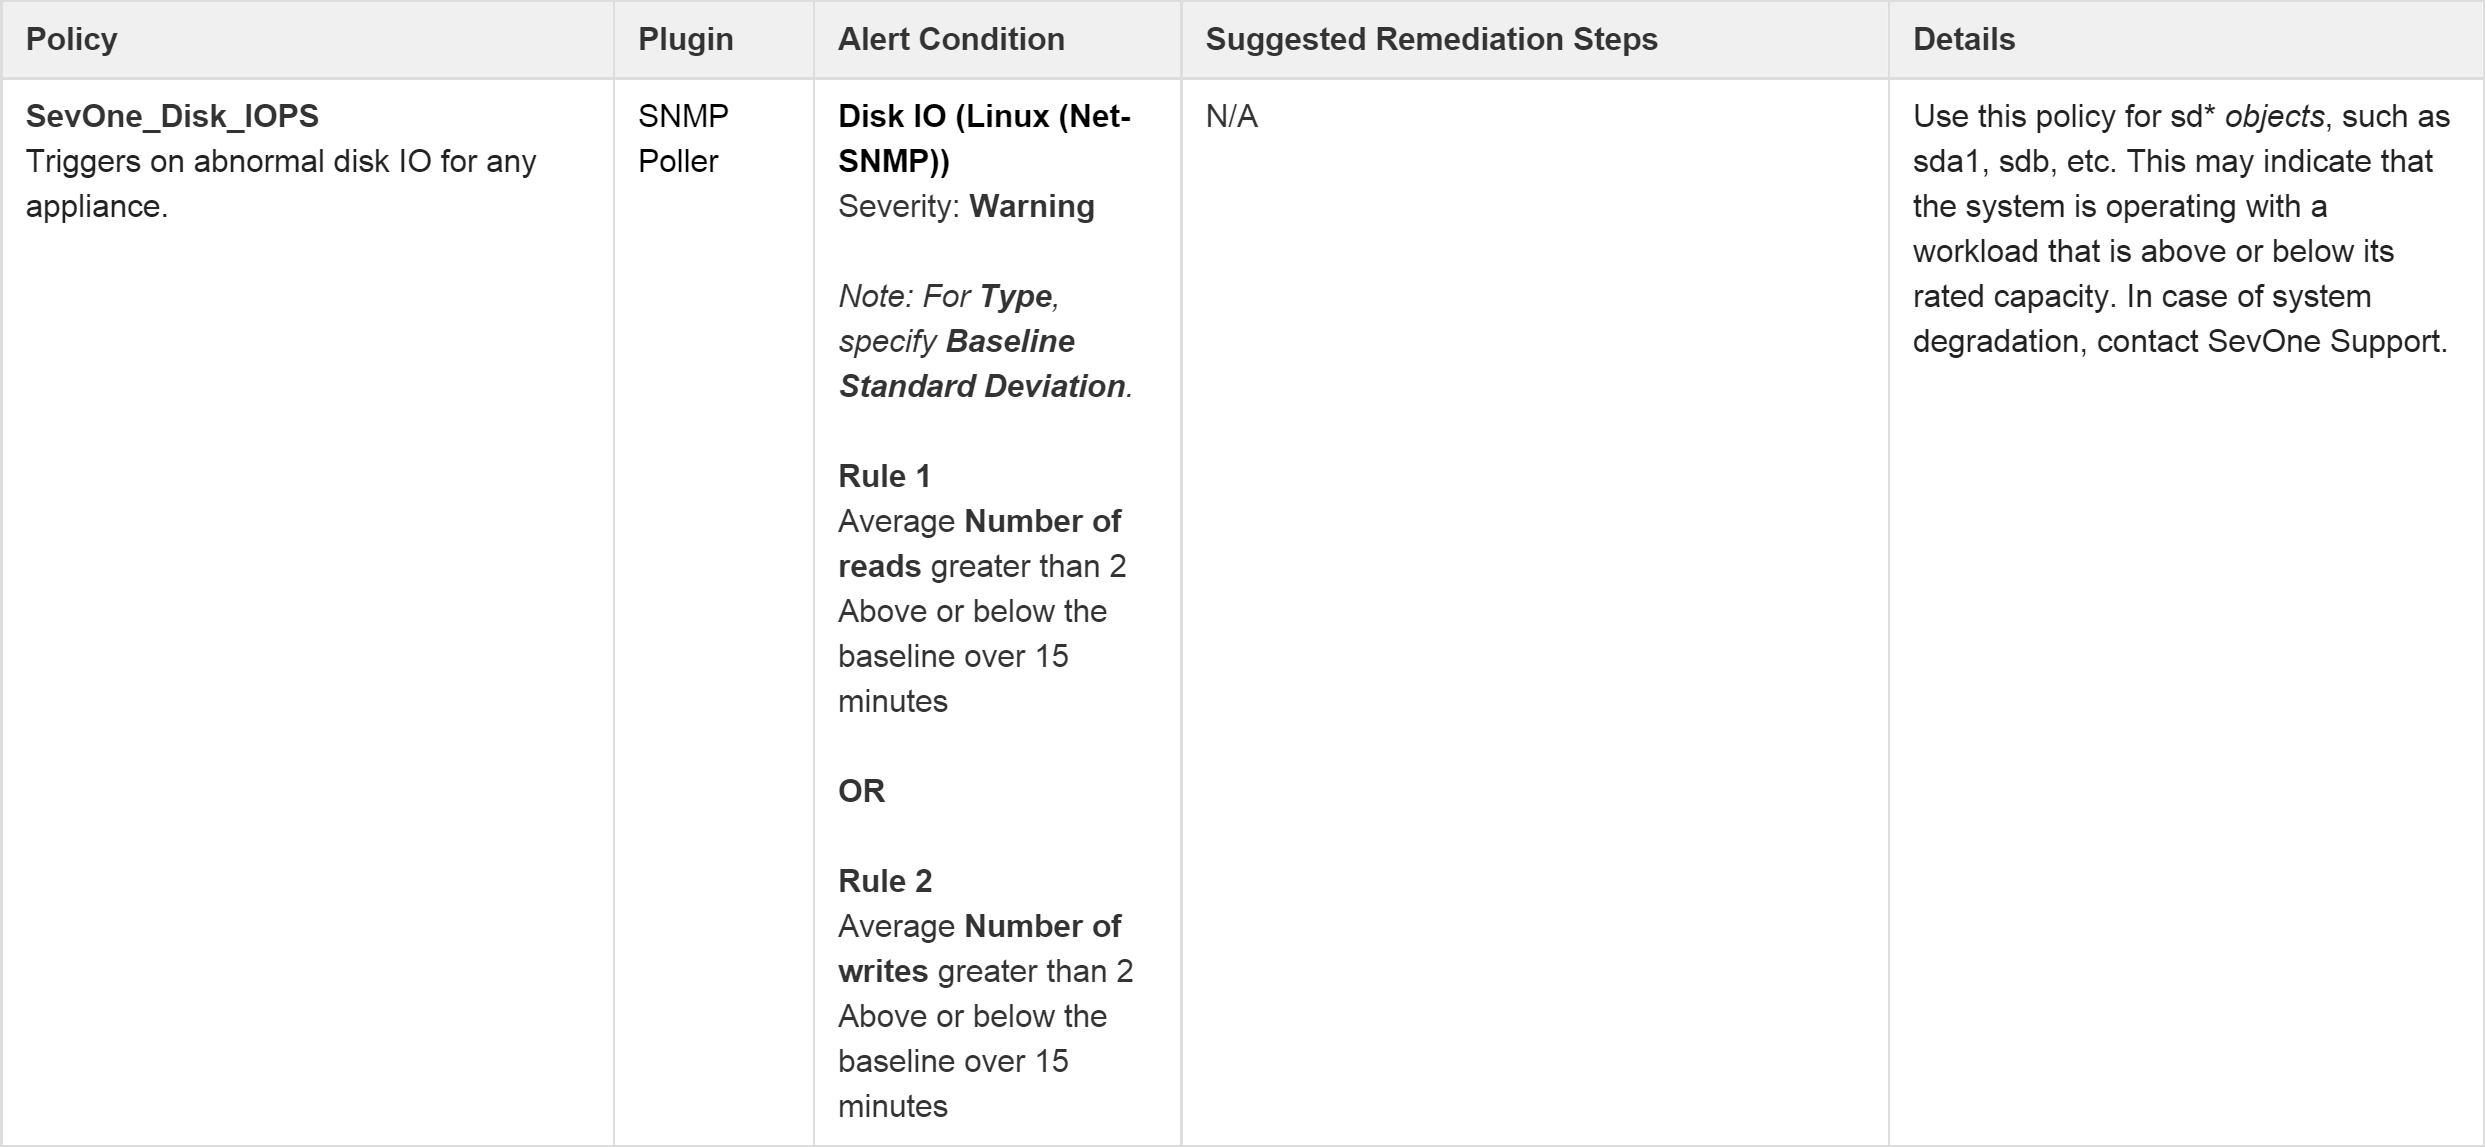
An OR Boolean operator indicates that only one condition (or set of conditions) must be met in order to trigger a threshold. In the screenshot below, only one of the conditions (Rule 1 or Rule 2) listed under Alert Condition needs to be met. In this case, you would need a separate Rule for each condition when creating conditions on the Trigger Conditions tab. (See information on using Rules.)
Recommended Policies
The following table contains recommended policies for SevOne self-monitoring.
|
Policy |
Plugin |
Alert Condition |
Suggested Remediation Steps |
Details |
|
SevOne_ICMP
|
ICMP Poller |
Ping Data |
N/A |
Check network connectivity to the appliance. If the network is okay, contact SevOne Support. |
|
SevOne_RaidArray
|
Deferred Data |
Raid Array |
Execute the following command: |
If degraded state is shown, replace failed disk. If rebuilding state is shown, array is healthy. |
|
SevOne_RaidDisk_PredictiveFail
|
Deferred Data |
Raid Array Disk |
N/A |
Contact SevOne Support. SevOne will ask to reseat drive before replacing it. Replace failed disk. |
|
SevOne_RaidDisk_Failure
|
Deferred Data |
Raid Array Disk |
N/A |
Contact SevOne Support. SevOne will ask to reseat drive before replacing it. Replace failed disk. |
|
SevOne_DiskUtilizationYellow
|
SNMP Poller |
Disk |
N/A |
Review settings in Administration > Cluster Manager > Cluster Settings > Storage. Specify lower number for Data Retention and Maximum Disk Utilization if possible. |
|
SevOne_DiskUtilizationRed
|
SNMP Poller |
Disk |
Execute the following command: |
After running the command, review settings in Administration > Cluster Manager > Cluster Settings > Storage. Specify lower number for Data Retention and Maximum Disk Utilization if possible. |
|
SevOne_Disk_IOPS |
SNMP Poller |
Disk IO (Linux (Net-SNMP))
|
N/A |
Use this policy for sd* objects, such as sda1, sdb, etc. This may indicate that the system is operating with a workload that is above or below its rated capacity. In case of system degradation, contact SevOne Support. |
|
SevOne_SwapRed
|
SNMP Poller |
Memory (Linux (Net-SNMP))
|
See Details before executing the following command. |
WARNING: This command may cause the loss of one poll cycle, and the past two hours of data may be briefly unavailable in the GUI (it will come back once the command finishes). This command will flush out any processes hogging up memory and will relieve the swap memory. |
|
SevOne_SwapYellow |
SNMP Poller
|
Memory (Linux (Net-SNMP))
|
Execute the following command: |
Consider running the command for SevOne_SwapRed (previous row). Otherwise, keep tabs on swap usage. |
|
SevOne_SNMP_availability
|
SNMP Poller |
SNMP Availability |
Execute the following command: |
If the command fails, contact SevOne Support.
|
|
SevOne_Portshaker_availability |
Portshaker Poller |
Port Data |
Contact SevOne Support. |
|
|
SevOne_polld_threadsActive |
SNMP Poller |
SevOne-polld - SevOne Process
|
Execute the following command: |
|
|
SevOne_Database_slaveStatus
|
MySQL Database Poller |
MySQL Server |
First, check replication using the following command:
|
Slave will never run on cluster master config. |
|
SevOne_polld_systemMemoryUsed |
Process Poller |
Process |
Check the polld logs for segfaults and ensure that polling is functioning correctly on the appliance. |
This policy would additionally work well with a PLA and can be used to identify potential problems with polld that may result in data loss. |
|
SevOne_DAEMON_mysqld
|
Process Poller |
Process |
Execute the following command: |
If the command fails, check firewall access on ports 3306 and 3307 (TCP). |
|
SevOne_DAEMON_apache
|
Process Poller |
Process |
Execute the following command: |
If the command fails, check firewall access on ports 80 and 443 (TCP). |
|
SevOne_PAS_DAEMON_polld
|
Process Poller |
Process |
Execute the following command: |
If the command fails, contact SevOne Support. |
|
SevOne_DAEMON_ntpd
|
Process Poller |
Process |
Execute the following command: |
If the command fails, check firewall access on port 123 (UDP). |
|
SevOne_PAS_DAEMON_netflowd
|
Process Poller |
Process |
Execute the following command: |
If the command fails, contact SevOne Support. |
|
SevOne_DNC_DAEMON_netflowd
|
Process Poller |
Process |
Execute the following command: |
If the command fails, contact SevOne Support. |
|
SevOne_DAEMON_requestd |
Process Poller |
Process |
Execute the following command: |
If the command fails, check firewall access on port 60006 (TCP). |
|
SevOne_DAEMON_requestd_Memory
|
Process Poller |
Process |
N/A |
Check network connectivity to the appliance. If the network is okay, contact SevOne Support. |
|
SevOne_DAEMON_sshd
|
Process Poller |
Process |
Execute the following command: |
If the command fails, check firewall access on port 22 (TCP).
|
|
SevOne_DAEMON_masterslaved |
Process Poller |
Process |
Execute the following command: |
If the command fails, check firewall access on port 5050 (TCP). |
|
SevOne_PAS_DAEMON_datad |
Process Poller |
Process |
Execute the following command: |
If the command fails, contact SevOne Support. |
|
SevOne_DAEMON_samplicate |
Process Poller |
Process |
Execute the following command: |
If the command fails, contact SevOne Support. |
|
SevOne_CPU_load |
SNMP Poller |
CPU |
N/A |
Contact SevOne Support. |
|
SevOne_Ethernet_traffic |
SNMP Poller |
Interface |
Consider moving devices to a different appliance. Otherwise, contact SevOne Support. |
|
Objects and Indicators
Below is a list of the objects employed in self-monitoring for SevOne NMS 5.3.8+ along with their indicators.
MySQL Server: mysqlconfig and mysqldata
In the past, there were two Deferred Data scripts were used for mysqlconfig and mysqldata. Now we have objects for them.
Indicators
Aborted_clients
Aborted_connects
Binlog_cache_disk_use
Binlog_cache_use
Bytes_received
Bytes_sent
Compression
Connections
Created_tmp_disk_tables
Created_tmp_files
Created_tmp_tables
Delayed_errors
Delayed_insert_threads
Delayed_writes
Flush_commands
Handler_commit
Handler_delete
Handler_prepare
Handler_read_first
Handler_read_key
Handler_read_next
Handler_read_prev
Handler_read_rnd
Handler_read_rnd_next
Handler_rollback
Handler_savepoint
Handler_savepoint_rollback
Handler_update
Handler_write
Key_blocks_not_flushed
Key_blocks_unused
Key_blocks_used
Key_read_requests
Key_reads
Key_write_requests
Key_writes
Max_used_connections
Not_flushed_delayed_rows
Open_files
Open_streams
Opened_tables
Prepared_stmt_count
Qcache_free_blocks
Qcache_free_memory
Qcache_hits
Qcache_inserts
Qcache_lowmem_prunes
Qcache_not_cached
Qcache_queries_in_cache
Qcache_total_blocks
Questions
Select_full_join
Select_full_range_join
Select_range
Select_range_check
Select_scan
Slave_open_temp_tables
Slave_retried_transactions
Slave_running
Slow_launch_threads
Slow_queries
Sort_merge_passes
Sort_range
Sort_rows
Table_locks_immediate
Table_locks_waited
Threads_cached
Threads_connected
Threads_created
Threads_running
Uptime
Percentage_prepared_stmt_count
Thread_cache_miss_rate
Redis Server
Indicators
Connections Received
Commands Processed
Used Memory
Keyspace Hits
Keyspace Misses
Expired Keys
Evicted Keys
PubSub Channels
PubSub Patterns
Raid Array
Indicators
Media Error Count
Other Error Count
Predictive Failure Count
Firmware State
SevOne-polld and SevOne-highpolld
Instead of using the Kron daemon, we now use the services SevOne-polld (regular SNMP polling) and SevOne-highpolld (high frequency SNMP polling) with modified metrics. The first section below lists these modified metrics. The second section lists the indicators that have been added.
Modified metrics:
Free Threads Minimum (Threads Idle Minimum)
Free Threads Maximum (Threads Idle Maximum)
Free Threads Average (Replaced with Threads Idle)
Used Threads Minimum (Threads Active Minimum)
Used Threads Maximum (Threads Active Maximum)
Used Threads Average (Threads Active)
Age of Threads Minimum (Gone)
Age of Threads Maximum (Gone)
Age of Threads Average (Gone)
Device Delay Minimum (Polling Delay Minimum)
Device Delay Maximum (Polling Delay Maximum)
Device Delay Average (Gone)
Polled Devices Minimum (Gone)
Polled Devices Maximum (Gone)
Polled Devices Average (Gone)
Suicidal Threads Minimum (Gone)
Suicidal Threads Maximum (Gone)
Suicidal Threads Average (Gone)
New indicators for SevOne-polld/SevOne-highpolld:
Database connections active
Database connections closed
Database connections opened
Database queries active
Database queries finished
Database queries started
Database queries errors
Database reconnections failed
Database reconnections succeeded
Database reconnections tried
Datad entries sent
Poller requests
Poller tasks finished
Poller tasks started
Start Time
Thread count