
Table of Contents (Start)
SevOne NMS 5.4 Quick Start Guide - xStats
SevOne NMS Documentation
All SevOne NMS user documentation is available online from the SevOne Support website.
-
Click Login.
-
Enter email address and password.
-
Click Login.
-
Scroll down to the Solutions section.
© Copyright 2015, SevOne Inc. All rights reserved. SevOne, SevOne PAS, SevOne DNC, Deep Flow Inspection, and Rethink Performance are either registered trademarks or trademarks of SevOne Inc. Other brands, product, service and company names mentioned herein are for identification purposes only and may be trademarks of their respective owners.
Introduction
This document describes the best practices for SevOne NMS users to implement and manage the polling of xStats data from your network.
The xStats plugin enables you to retrieve or import any data that can be made available in a flat file format into SevOne NMS for monitoring and reporting purposes. SevOne NMS supports the collection of xStats data from any format that provides the ability to programmatically parse the files to CSV, XML, JSON and other common file types. The xStats plugin receives or imports these files to the SevOne NMS appliance via SFTP, HTTP, or other methods. Contact your SevOne Sales Engineer to discuss your network's xStats parser specifications. SevOne Developers create a custom parser for your requirements and upload the parser to your SevOne NMS appliance. You then configure your Access Control Lists to open appropriate ports for your network to communicate with the SevOne NMS appliance. When your implementation includes multiple parsers, several parsers can simultaneously monitor a single device.
In SevOne NMS, plugins are mechanisms that poll (collect, ask for, etc.) data from technologies. Plugins define a way to get data, usually via some protocol such as SNMP, ICMP, WMI, etc. Most plugins are automatically enabled when you add a device to SevOne NMS so you can poll applicable objects with minimal configuration. The exceptions are; CallManager, JMX, NAM, Telephony, VMware, and WMI which require device specific input.
Objects are discrete components of a device or a software component that have one or more performance indicators on which SevOne NMS can monitor, trend, and alert. SevOne NMS considers an element to be any performance object. Indicators are grouped by indicator types which in turn are grouped by object types.
-
Object Types - Define logical things to ask for information about.
-
Indicator Types - Define kinds of metrics that object types can have.
The xStats plugin is unique in that it uses the xStats sources you define on the xStats Source Manager to create devices in SevOne NMS. The source also creates the applicable xStats object types that appear on the Object Type Manager and the xStats indicator types that appear on the Indicator Type Manager.
xStats Source Manager
Sources are parser specific means of collecting xStats data. xStats parsers are manufacturer/equipment specific applications that are created for your implementation based upon discussions you have with your SevOne Sales Engineer. The xStats Source Manager enables you to manage the data collection sources for the xStats plugin to use. You can create an unlimited number of xStats sources.
Data the xStats source collects creates the xStats devices, xStats object types, and xStats indicator types in SevOne NMS. Additional data about xStats sources appears on the xStats Log Viewer page.
To access the xStats Source Manager from the navigation bar, click the Administration menu, select Monitoring Configuration, and then select xStats Source Manager.

Perform the following steps to manage xStats sources.
-
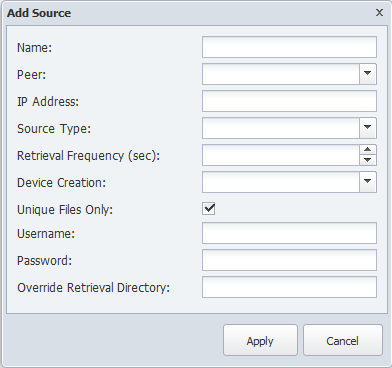
Click Add Source or click
 in the Actions column to display the Add/Edit Source pop-up.
-
In the Name field, enter the source name.
-
Click the Peer drop-down and select the peer to monitor data from the source. Each source has a different load impact on the appliance. In larger clusters, it may be beneficial to distribute the source load among your SevOne NMS peers.
-
In the IP Address field, enter the IP address of the device from which the source is to monitor data.
-
Click the Source Type drop-down list and select the collection method for the source to use.
-
In the Retrieval Frequency (seconds) field, enter the number of seconds for how frequently the source is to attempt to retrieve/receive new data. The retrieval duration for each source can be set to any value, but is most commonly set to 300 seconds (5 minutes).
-
Click the Device Creation drop-down.
-
Select Manual to enable manual addition of the devices the source discovers to SevOne NMS and the ability to link the devices the source discovers to devices that already exist in SevOne NMS.
-
Select Automatic to automatically add the devices that the source discovers to SevOne NMS and for display on the Device Manager with the xStats plugin enabled.
-
-
Select the Unique Files Only check box to have the source collect only files that have yet to be collected. Leave clear to collect all available files from the devices even if the file was previously collected and to re-process all previous data from those files.
-
In the Username field, enter the user name SevOne NMS needs to authenticate onto the device from where the source data is to be monitored.
-
In the Password field, enter the password SevOne NMS needs to authenticate onto the device.
-
In the Override Retrieval Directory field, enter the full path to the directory on the SevOne NMS appliance where you prefer to store data. Leave this field blank to accept the default directory.
Manage xStats Devices
The xStats data from the source creates devices. The Devices column displays the number of devices the source creates and the number of new devices that the latest poll found. When you define a source, you choose to require manual intervention to add the xStats devices to SevOne NMS or to have the source automatically add the devices to SevOne NMS.
When you click the link in the Devices column or click  in the Actions column to display the Manage Devices pop-up.
-
Watched Displays
 when the device is watched by the xStats plugin or displays
  when the device is ignored by the xStats plugin.
 -
Name From Source - Displays the name of the device as discovered by the xStats source.
-
IP Address - Displays the IP address of the device.
-
First Seen - Displays the date/time the devices first appears from the xStats source.
-
Last Seen - Displays the date/time the device most recently appears from the source.
-
Name in SevOne - Displays the name of the device that displays on the Device Manager.
-
 - Click to display the Edit Device page where you can edit the device.
 -
 - Click to display a link to the Device Summary and links to the report templates that are applicable for the device.
 -
 - When you define the source to require manual device creation, this icon enables you to link the new device to a device that is already in SevOne NMS. This is useful when multiple sources find the same xStats device.
 -
 - When you define the source to require manual device creation this icon enables you to add the device as a new device.
Enable xStats Plugin
The xStats source creates devices in SevOne NMS. The xStats plugin is automatically enabled for the devices the source creates. You do not add devices to SevOne NMS for xStats. The Device Manager provides access to the Edit Device page where you can disable/enable the xStats plugin for the devices the source creates.
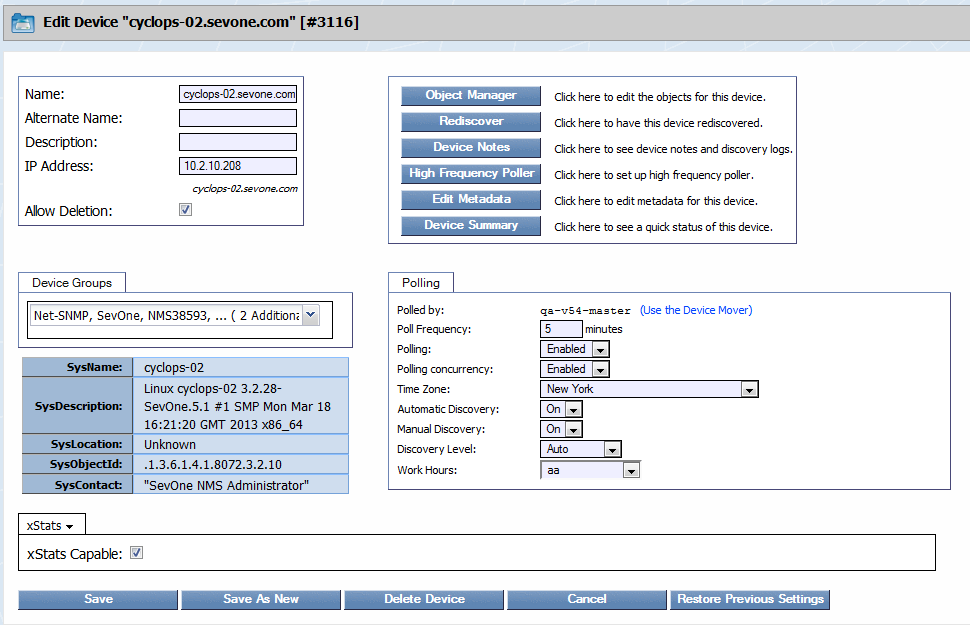
Perform the following steps to manage the xStats plugin for a device in SevOne NMS.
-
From the navigation bar, click Devices and select Device Manager to display the Device Manager.
-
Click
 next to a device to display the Edit Device page.
 -
In the plugin section (displays SNMP by default), click the drop-down and select xStats.
-
Clear/select the xStats Capable check box to disable/enable the processing of xStats data for the device.
Manage xStats Object Types and Indicator Types
The Object Types page enables you to manage the object types and the indicator types the xStats sources create. The xStats object types each source creates are enabled by default. The Object Types page enables you to add, edit, delete, and disable xStats object types and indicator types.
The Object Rules page enables you to define rules to disable polling of objects and the Object Manager enables you to manage the objects on each device.
To access the Object Type Manager from the navigation bar, click the Administration menu, select Monitoring Configuration, and then select Object Types.
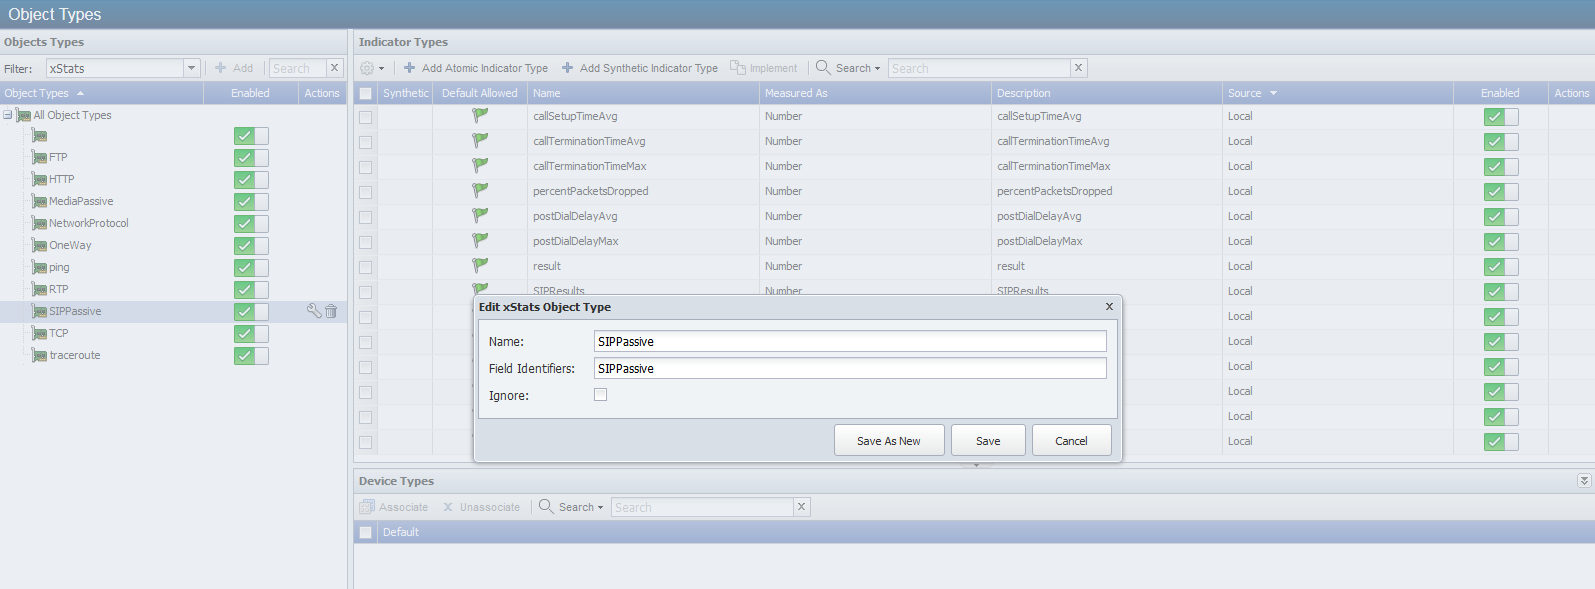
Manage xStats Object Types
Perform the following steps to manager xStats object types.
-
Click the Filter drop-down and select xStats to display the xStats object types in the Object Types hierarchy.
-
Click Add or click
 to display the Add/Edit xStats Object Type pop-up.
 -
In the Name field, enter the name of the object type.
-
In the Field Identifiers field, enter the object type field identifiers the source provides.
-
Select the Ignore check box to have the xStats plugin not monitor the object type.
-
Click Save.
Manage xStats Atomic Indicator Types
The Object Types page enables you to manage the indicator types the xStats sources create.
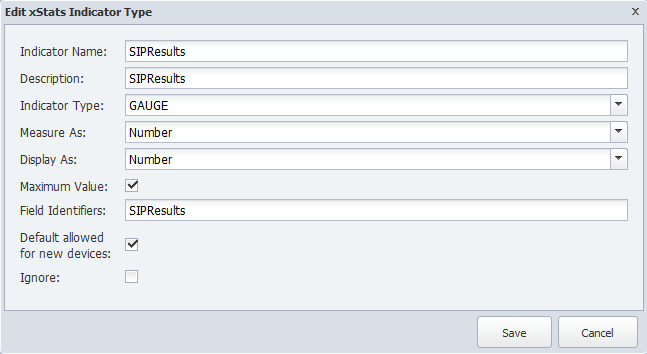
Perform the following steps to manage xStats atomic indicator types.
-
Click the Filter drop-down and select xStats to display the xStats object types in the Object Type hierarchy.
-
Click on an object type to display its indicator types on the right.
-
Click Add Atomic Indicator Type or click
 to display the Add/Edit xStats Indicator Type pop-up.
 -
In the Indicator Name field enter the name of the indicator type.
-
In the Description field, enter the name to display.
-
Click the Indicator Type drop-down and select a type.
-
Click the Measure As drop-down and select a data unit.
-
Click the Display As drop-down and select a display unit.
-
Select the Maximum Value check box to indicate the indicator has a maximum value.
-
In the Field Identifiers field, enter the object type field identifiers.
-
Select the Default Allowed for New Devices check box to have the xStats plugin monitor the indicator type by default when the object type is enabled and you enable the xStats plugin for a device.
-
Select the Ignore check box to have the xStats plugin ignore the indicator type.
-
Click Save.
xStats Synthetic Indicator Types
Synthetic indicator types enable you to perform math on multiple metrics collected from multiple indicators on a single monitored object in order to calculate new KPIs.
Synthetic indicator types behave similar to the Calculation Editor that enables you to create custom calculation objects that perform math on multiple metrics collected from multiple objects and/or multiple synthetic indicators that you poll via the Calculation plugin. This enables you create your own KPIs even when those KPIs do not exist on a device such as Percentage Loss, Percent Error, and Percent Idle. Synthetic indicators are always gauge type indicators and SevOne NMS evaluates all the indicator values the synthetic indicator uses as if the value is a gauge.
Example: You want to monitor voice gateways to reveal which PRI gets the most or least usage. Typical poll metrics enable you to report on the status of individual bearer channels and not the sum of all channels at any given time. This makes it difficult to monitor and alert on total PRI usage. Synthetic indicators enable you to sum the bearer channel statuses (each channel gets a value of 1 when busy), divide by the total number of bearer channels (23), and then multiply by 100, to collect the desired metric for PRI % usage.
You can define synthetic indicator types for the following plugins: Calculation, CallManager, Deferred Data, JMX, SNMP, WMI, and xStats.
-
Click the Filter drop-down and select xStats Poller to display the object types in the hierarchy.
-
Click on an object type to display its indicator types on the right. If the object type does not have any indicator types, the Add Synthetic Indicator Type button does not appear.
-
Click Add Synthetic Indicator Type or click
 next to a synthetic indicator type to display the Add/Edit Synthetic Indicator Type pop-up.
 -
In the Indicator Name field, enter the name of the synthetic indicator type.
-
In the Description field, enter the name to display.
-
The Synthetic Indicator Expression field enables you to define the calculation.
If the border around the field turns red, your calculation is invalid and your graph results will be erroneous.
-
Click an indicator type in the Available Source Indicators field and drag it to the Synthetic Indicator Expression field. The Available Source Indicators field contains the indicator types associated to the object type you select in the hierarchy.
-
Enter applicable operators in the Synthetic Indicator Expression field to formulate the calculation. See the Acceptable Operators section below.
-
Drag additional source indicator types and enter additional mathematical symbols to create the expression in the Synthetic Indicator Expression field.
-
-
The Maximum Value Expression field enables you to define the indicator type maximum value calculation.
-
Click an indicator type in the Available Source Indicators field and drag it to the Maximum Value Expression field.
-
Enter applicable operators in the Maximum Value Expression field to formulate the calculation. See the Acceptable Operators section below.
-
Drag additional source indicator types and enter additional mathematical symbols to create the expression in the Maximum Value Expression field.
-
-
Click the Measure As drop-down and select the unit of measure to use to measure the data.
-
Click the Display As drop-down and select the unit of measure in which a display the data.
-
Select the Default Allowed for New Devices check box to have the plugin poll the indicator type by default when the object type is enabled and you enable the plugin for a device.
-
Click Save.
Acceptable Operators
Your expression formula can include the following characters:
-
+ add
-
- subtract
-
* multiply
-
/ device
-
& & logical and
-
|| logical or
-
<= less or equal
-
>= greater or equal
-
! not equal
-
== equal
-
> greater than
-
< less than
-
^ raise x to the power of y
-
% modulus
-
?: if then else
If your calculation results in either of the following invalid values, there will be a gap in your graph: Not a Number (NAN) and Infinity (+/-INF). The following is how SevOne NMS attempts to prevent invalid values.
In sequence of processing:
-
Zero divided by zero results in NAN.
-
Any positive value divided by zero results in +INF.
-
Any negative value divided by zero results in -INF.
-
Zero multiplied by +/-INF results in NAN.
-
Any value added to, subtracted from, multiplied by, divided by, or divided from NAN results in NAN.
-
Any value compared to NAN (<, <=, ==, >=, >) results in 0. NAN != NAN.
-
Any value compared to +INF is less than +INF, except that +INF == +INF
-
Any value compared to -INF is greater than -INF, except that -INF == -INF
-
Any value added to or subtracted from +INF results in +INF
-
Any positive value multiplied by +/-INF results in +/-INF
xStats Log Viewer
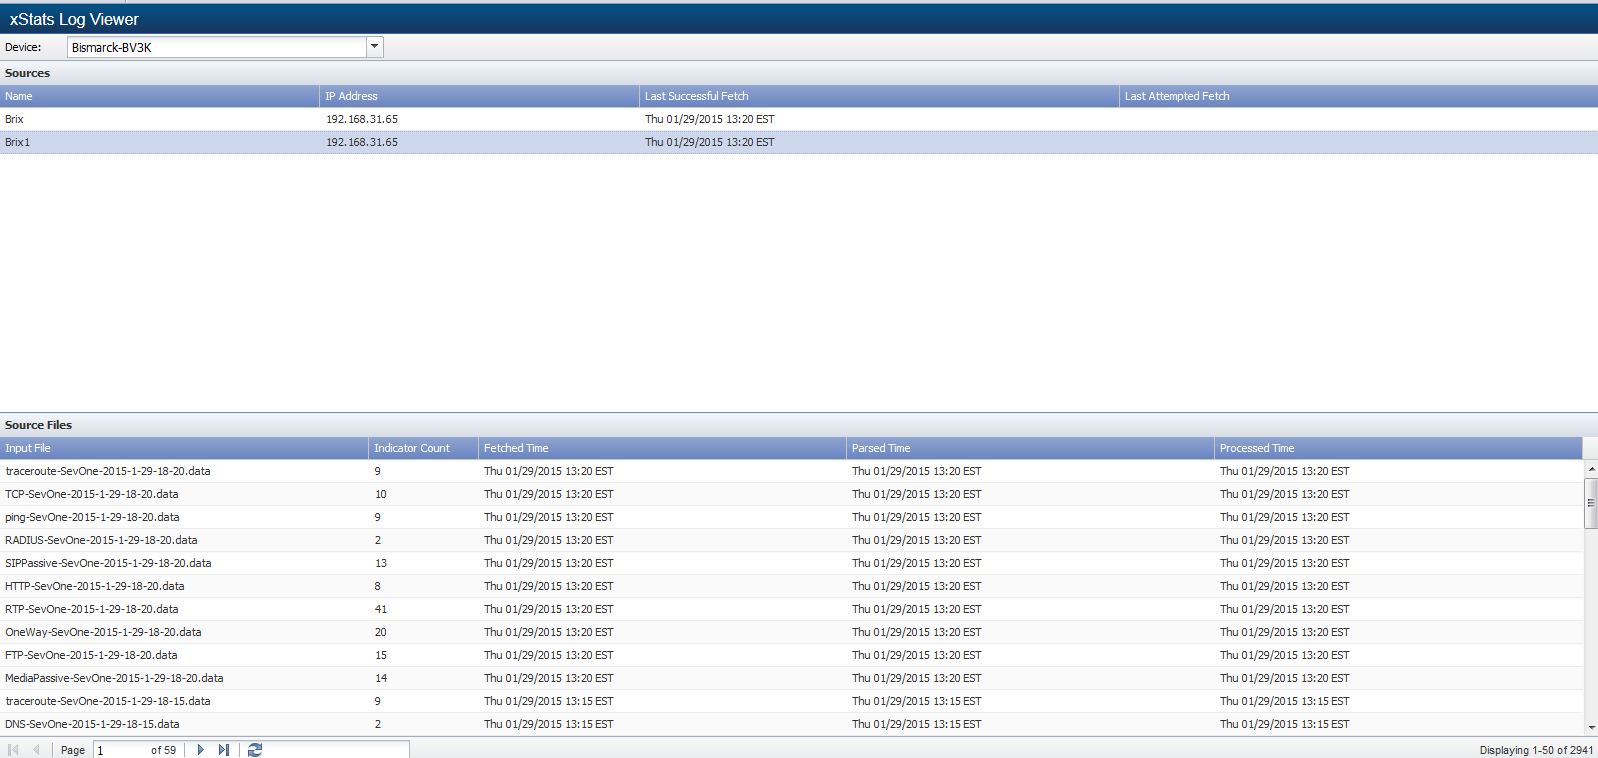
The xStats Log Viewer enables you to view additional details from the xStats sources you define on the xStats Source Manager. xStats sources create the xStats devices, objects, and indicators the xStats plugin polls.
To access the xStats Log Viewer from the navigation bar, click the Administration menu, select Monitoring Configuration, and then select xStats Log Viewer.
Sources
When you create an xStats source on the xStats Source Manager, the Sources section displays the following information.
-
Name - Displays the xStats source name.
-
IP Address - Displays the IP address of the device from which the source retrieves/receives xStats data.
-
Last Successful Fetch - Displays the date and time the source most recently performed a successful collection of xStats data.
-
Last Attempted Fetch - Displays the date and time the source most recently attempted to fetch xStats data.
Source Files
The Source Files section displays the following information.
-
Input File - Displays the name of the file the xStats source fetched/received.
-
Indicator Count - Displays the number of indicators the xStats source found in the file.
-
Fetched Time - Displays the time the source fetched the file.
-
Parsed Time - Displays the time the xStats parser parsed the file.
-
Processed Time - Displays the time the xStats plugin processed the xStats data.