
Table of Contents (Start)
SevOne NMS 5.4 Quick Start Guide - WMI
SevOne NMS Documentation
All SevOne NMS user documentation is available online from the SevOne Support website.
-
Enter email address and password.
-
Click Login.
-
Click the Solutions icon.
© Copyright 2015, SevOne Inc. All rights reserved. SevOne, SevOne PAS, SevOne DNC, Deep Flow Inspection, and Rethink Performance are either registered trademarks or trademarks of SevOne Inc. Other brands, product, service and company names mentioned herein are for identification purposes only and may be trademarks of their respective owners.
Introduction
This document describes the best practices for SevOne NMS users to implement and manage the polling of Windows Management Instrumentation (WMI) data from your network.
WMI is the infrastructure for management data and operations on Windows operating systems. WMI supplies management data to other parts of the operating system and products. SevOne NMS monitors the Windows desktop units, Windows servers, SQL Server databases, and other WMI enabled systems in your implementation.
There are several steps to enable SevOne NMS to monitor WMI data.
A) Set up the WMI proxy server to communicate with SevOne NMS.
B) Set up your network's Windows devices to communicate with the WMI proxy server.
C) Set up the WMI plugin for each WMI device.
D) Enable WMI Object Types.
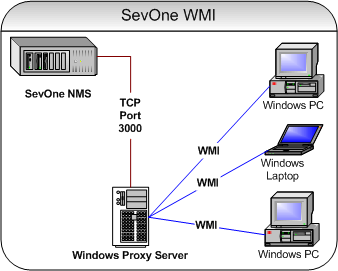
SevOne NMS – WMI Proxy – Windows Devices
In SevOne NMS, plugins are mechanisms that poll (collect, ask for, etc.) data from technologies. Plugins define a way to get data, usually via some protocol such as SNMP, ICMP, WMI, etc. Many plugins are automatically enabled when you add a device to SevOne NMS so you can poll applicable objects with minimal configuration. WMI requires device specific input.
Objects are discrete components of a device or a software component that have one or more performance indicators on which SevOne NMS can monitor, trend, and alert. SevOne NMS considers an element to be any performance object. Indicators are grouped by indicator types which in turn are grouped by object types.
-
Object Types - Define logical things to ask for information about.
-
Indicator Types - Define kinds of metrics that object types can have.
The WMI plugin detects and monitors the WMI indicators for the object types that you enable to be polled. When you enable the WMI plugin, SevOne NMS discovers the device and any objects for the WMI object types and indicator types you enable from the Object Types page.
WMI Performance Indicators
WMI data appears throughout SevOne NMS including Instant Graphs and TopN Reports and you can mix and match WMI and SNMP to create logical thresholds. The WMI plugin can poll the following common performance indicators for reports.
-
CPU Usage
-
VMware
-
ASP.NET
-
Hard Drive Usage
-
Memory Usage
Prerequisites
Prerequisites include setting up and knowing:
-
WMI Proxy Name
-
WMI Proxy IP Address
-
Port Number for WMI Proxy to Use (default - 3000)
-
WMI Device User Names
-
WMI Device Passwords
-
WMI Device Workgroups or Domains
Set Up WMI Proxy Servers
SevOne provides a Windows service for installation on the Windows device you designate to act as the proxy to perform WMI queries.
This chapter describes workflows outside of the SevOne NMS application and may not present all of the steps your network requires to enable devices to send WMI data. If the following instructions are not applicable for your network please reference the device manufacturer's documentation.
-
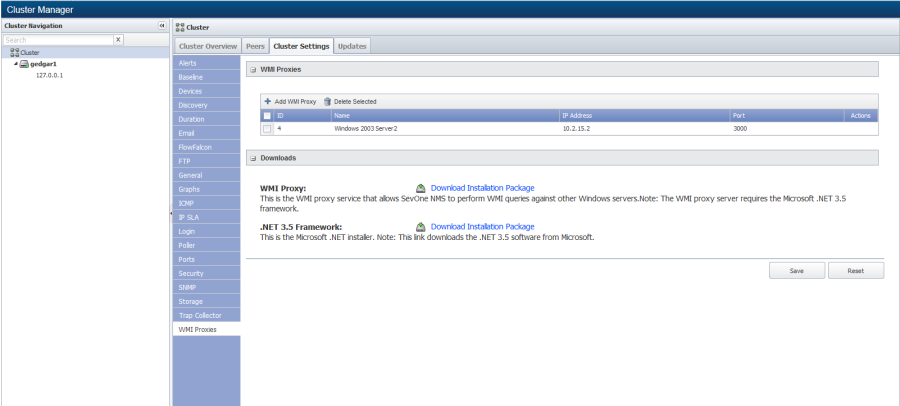
In SevOne NMS, click the Administration menu and select Cluster Manager to display the Cluster Manager. The default display is the cluster level.
-
At the cluster level select the Cluster Settings tab.
-
Select the WMI Proxies subtab.
-
Click the WMI Proxy – Download Installation Package link and save the file to the proxy device.
-
If the proxy device is not running the Microsoft .NET 3.5 framework, click the .NET 3.5 Framework – Download Installation Package link and save the file to the proxy device.
-
On the proxy device run the .NET 3.5 Framework setup.exe, if needed, and then run the WMI Proxy.msi to install the SevOne WMI Server service.
-
Click Start and select Control Panel.
-
Double-click Administrative Tools.
-
Double-click Component Services.
-
Double-click Services (Local).
-
Right-click on WMI Server and select Start.
-
On the WMI proxy device, ensure that the user account that SevOne NMS uses to access the proxy server is the local administrator.
-
In SevOne NMS, return to the WMI Proxies subtab on the Cluster Manager (Administration > Cluster Manager >Cluster Settings > WMI Proxies). You can also access the Cluster Manager from the WMI plugin on the Edit Device page.
-
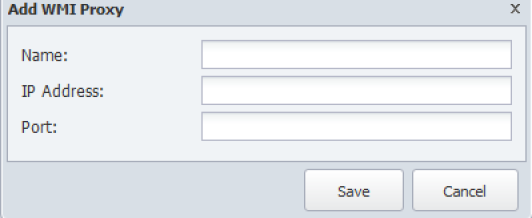
Click Add WMI Proxy or click
 to display the Add/Edit WMI Proxy pop-up.
-
In the Name field, enter the name of the WMI proxy device.
-
In the IP Address field, enter the IP address of the WMI proxy device.
-
In the Port field, enter the port on the WMI proxy device for SevOne NMS to use to communicate with the WMI proxy (typically 3000).
-
Click Save to save the WMI proxy information in SevOne NMS.
-
Repeat these steps to create multiple WMI proxy servers.
-
Click Save on the Cluster Manager WMI Proxies subtab.
Enable Devices to Send WMI Data to WMI Proxy Device
This section describes how to enable WMI, allow remote administration, and enable the Windows device to communicate back to the WMI proxy on each Windows device from which you want to poll WMI data. WMI must establish a DCOM connection from Computer A (the SevOne NMS WMI proxy server) to Computer B (the remote computer). The following diagram shows this as Connection 1. To establish this connection, configure both the Windows Firewall and DCOM on Computer B. The configuration must be done locally on Computer B because Windows Firewall does not support remote configuration. Either execute NETSH commands to change the Group Policy settings or execute a script locally.

Computer A is the WMI Proxy Device for SevOne NMS to Poll
Computer B Represents Each of Your Network's Windows Devices
Enable WMI
This chapter describes workflows outside of the SevOne NMS application and may not present all of the steps your network requires to enable devices to send WMI data. If the following instructions are not applicable for your network please reference the device manufacturer's documentation.
-
Click Start and select Control Panel.
-
Double-click Administration Tools.
-
Double-click Services.
-
Scroll down, right-click on WMI Performance Adapter, and select Start.
-
Right-click on WMI Performance Adapter and select Properties.
-
Select the General tab.
-
Click the Startup Type drop-down and select Automatic to have this service start every time the computer starts.
-
Continue to the next section to allow remote administration on each Windows device (create Connection 1 in the diagram).
Allow Remote Administration
On each Windows device enable Allow Remote Administration to allow the Windows device to accept the communication from the WMI proxy device.
You can enter one of the following command:
For Windows 7+ enter: netsh advfirewall firewall set rule group="Windows Remote Management" new enable=yes
For Windows older than 7 enter: Netsh firewall set service RemoteAdmin enable
Or you can perform the following steps:
-
Click Start and select Run.
-
In the Open field, enter gpedit.msc and click OK to display the Group Policy page.
-
On the right in the Local Computer Policy section, double-click Computer Configuration.
-
Double-click Administrative Templates.
-
Double-click Network.
-
Double-click Network Connections.
-
Double-click Windows Firewall.
-
Perform one of the following steps:
-
If the computer is in the domain, double-click Domain Profile.
-
If the computer is not in the domain, double-click Standard Profile.
-
-
Right-click on Windows Firewall: Allow Remote Administration Exception and select Properties.
-
Select the Enabled option.
-
Click OK.
-
Click X to close the Group Policy page.
-
Continue to the next section to allow the Windows device to communicate with the WMI proxy.
Enable Windows Devices to Communicate Back to the WMI Proxy
The connection from Computer B to Computer A (Connection 2 in the diagram) is only required when the client script or application makes an asynchronous call to the remote computer. If Computer B is either a member of a Workgroup or is in a different domain that is not trusted by Computer A, then Connection 2 is created as an Anonymous connection.
-
If the Windows Firewall is enabled on Computer A, enter the following command on Computer A to enable Allow Remote Administration exception and to open DCOM port TCP 135 on Computer A.
netsh firewall add portopening protocol=tcp port=135 name=DCOM_TCP135 -
Add the client application script, which contains the sink for callback to the Windows Firewall Exception List on Computer A. If the client is a script or a MMC snap-in, the sink is often Unsecapp.exe. For these connections, add %windir%\system32\wbem\unsecapp.exe to the Windows Firewall application exceptions list.
netsh firewall add allowedprogram program=%windir%\system32\wbem\unsecapp.exe name=UNSECAPP
Enable WMI Plugin
The WMI plugin requires device specific configuration and is therefore disabled on new devices by default. The Device Manager provides access to the Edit Device page where you enable and configure the WMI plugin for each device.

Perform the following steps to enable the WMI plugin for each device from which to discover WMI objects and to poll WMI metrics.
-
From the navigation bar, click Devices and select Device Manager to display the Device Manager.
-
Click
 next to a device to display the Edit Device page.
 -
In the plugin section (displays SNMP by default), click the drop-down and select WMI.
-
Select the WMI Capable check box to enable discovery of the WMI object types you enable and to poll WMI data on the device.
-
Click the Proxy drop-down and select the WMI proxy server from which to poll WMI data for the device. Click the WMI Proxies can be managed... link to display the Cluster Manager.
-
In the Username field, enter the user name the proxy needs to authenticate onto the device.
-
In the Password field, enter the password the proxy needs to authenticate onto the device.
-
In the Workgroup/Domain field, enter the workgroup or domain for the device.
-
Click the Authentication drop-down and select the authentication level to use to access the device. This is typically set to Default. You may need to experiment here and you may need to select an Advanced authentication method. (Settings that work in most environments are Default and Packet.)
-
Click the Impersonation drop-down and select the impersonation level to use to access the device. This is typically set to either Default or Impersonate.
-
Select the Use NTLM check box if your network uses the NT LAN Manager suite of Microsoft security protocols. Kerberos has replaced NTLM as the default authentication protocol in an Active Directory based single sign-on scheme. Leave clear if your network uses Kerberos.
-
Click Save.
Manage WMI Object Types and Indicator Types
The WMI plugin discovers the WMI object types on the devices you enable to send WMI data to SevOne NMS. WMI object types are disabled by default. The Object Rules page enables you to define rules to disable polling of objects and the Object Manager enables you to manage the objects on each device. The Object Types page enables you to manage WMI object types and indicator types.
To access the Object Types page from the navigation bar, click the Administration menu, select Monitoring Configuration, and then select Object Types.
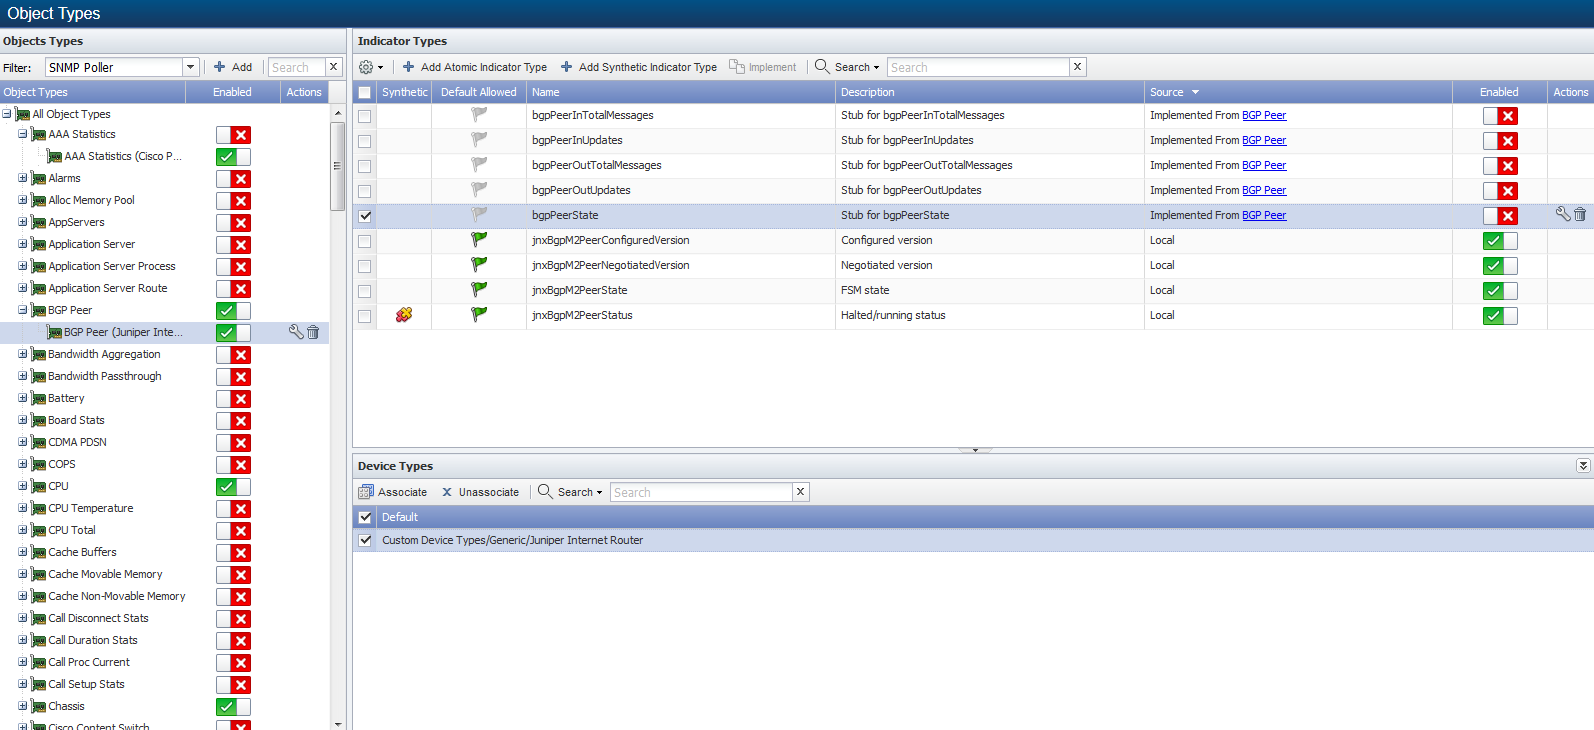
Click the Filter drop-down and select WMI Poller to display the object types the WMI plugin can poll in the Object Types hierarchy on the left.
Manage JMX Object Types
Perform the following steps to manage WMI object types

-
Above the Object Types hierarchy, click Add or click
 to display the Add/Edit WMI Object Type pop-up.
 -
In the Name field, enter the object type name.
-
In the Class Name field, enter the class name.
-
In the Alias field, enter the alias.
-
Select the Enabled check box to enable the WMI plugin to poll the indicator types in the object type.
-
Click Save.
Manage JMX Indicator Types
Indicator types determine what indicators are polled for an object type. The indicator types list displays the indicator types for the object type you select in the Object Types hierarchy. There are two types of indicator types.
-
Atomic indicator types are measured directly by the plugin.
-
Synthetic indicator types are indicators whose value is dependent upon other indicators; atomic and/or synthetic. Synthetic indicators enable you to combine the data from several indicators into one synthetic indicator so that SevOne NMS can properly evaluate indicators such as Percentage Loss, Percent Error, Percent Idle, and other high precision metrics.
Manage WMI Atomic Indicator Types
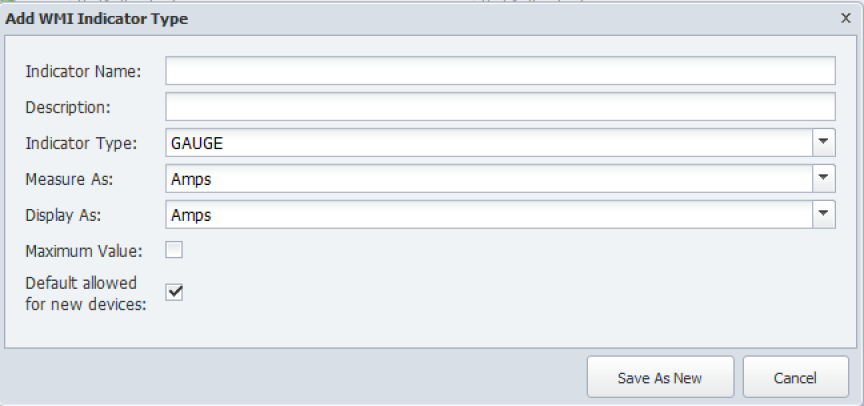
Perform the following steps on the Object Types page to manage WMI atomic indicator types.
-
Click on a WMI object type in the hierarchy to display its indicator types on the right.
-
Click Add Atomic Indicator Type or click
 to display the Add/Edit WMI Indicator Type pop-up.
 -
In the Indicator Name field enter the name of the indicator type.
-
In the Indicator Display Name field, enter the name to display.
-
Click the Indicator Type drop-down and select a type.
-
Click the Measure As drop-down and select a data unit.
-
Click the Display As drop-down and select a display unit.
-
Select the Maximum Value check box to indicate the indicator has a maximum value.
-
Select the Default allowed for new devices check box to have the WMI plugin poll the indicator type by default when the object type is enabled and you enable the WMI plugin for the device.
-
Click Save.
Manage WMI Synthetic Indicator Types
Synthetic indicator types enable you to perform math on multiple metrics collected from multiple indicators on a single monitored object in order to calculate new KPIs.
This feature enables you create your own KPIs even when those KPIs do not exist on a device such as Percentage Loss, Percent Error, and Percent Idle. Synthetic indicators are always gauge type indicators and SevOne NMS evaluates all the indicator values the synthetic indicator uses as if the value is a gauge.
Example: You want to monitor voice gateways to reveal which PRI gets the most or least usage. Typical poll metrics enable you to report on the status of individual bearer channels and not the sum of all channels at any given time. This makes it difficult to monitor and alert on total PRI usage. Synthetic indicators enable you to sum the bearer channel statuses (each channel gets a value of 1 when busy), divide by the total number of bearer channels (23), and then multiply by 100, to collect the desired metric for PRI % usage.
-
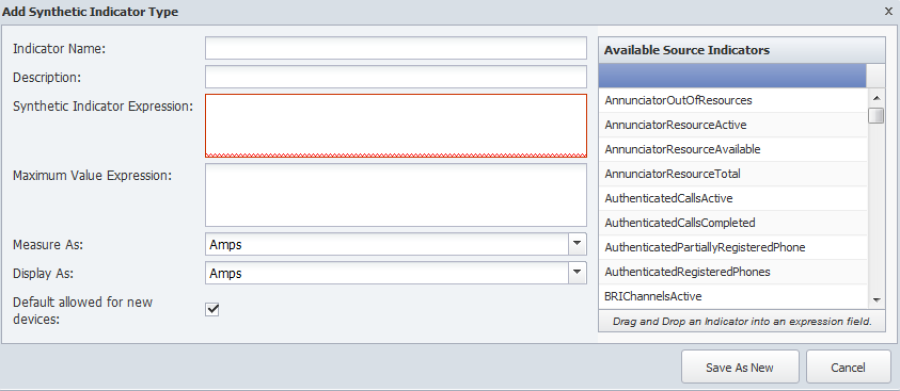
Click on a WMI object type to display its indicator types on the right. If the object type does not have any indicator types, the Add Synthetic Indicator Type button does not appear.
-
Click Add Synthetic Indicator Type or click
 next to a synthetic indicator type to display the Add/Edit Synthetic Indicator Type pop-up.
 -
In the Indicator Name field, enter the name of the synthetic indicator type.
-
In the Description field, enter the name to display.
-
The Synthetic Indicator Expression field enables you to define the calculation. If the border around the field turns red, your calculation is invalid and your graph results will be erroneous.
-
Click an indicator type in the Available Source Indicators field and drag it to the Synthetic Indicator Expression field. The Available Source Indicators field contains the indicator types associated to the object type you select in the hierarchy.
-
Enter applicable operators in the Synthetic Indicator Expression field to formulate the calculation. See the Acceptable Operators section below.
-
Drag additional source indicator types and enter additional mathematical symbols to create the expression in the Synthetic Indicator Expression field.
-
-
The Maximum Value Expression field enables you to define the indicator type maximum value calculation.
-
Click an indicator type in the Available Source Indicators field and drag it to the Maximum Value Expression field.
-
Enter applicable operators in the Maximum Value Expression field to formulate the calculation. See the Acceptable Operators section below.
-
Drag additional source indicator types and enter additional mathematical symbols to create the expression in the Maximum Value Expression field.
-
-
Click the Measure As drop-down and select a data unit.
-
Click the Display As drop-down and select a display unit.
-
Select the Default Allowed for New Devices check box to have the plugin poll the indicator type by default when the object type is enabled and you enable the plugin for a device.
-
Click Save.
Acceptable Operators
Your expression formula can include the following characters:
-
+ add
-
- subtract
-
* multiply
-
/ device
-
& & logical and
-
|| Logical or
-
<= less or equal
-
>= greater or equal
-
! not equal
-
== equal
-
> greater than
-
< less than
-
^ raise x to the power of y
-
% modulus
-
?: if then else
If your calculation results in either of the following invalid values, there will be a gap in your graph: Not a Number (NAN) and Infinity (+/-INF). The following is how SevOne NMS attempts to prevent invalid values.In sequence of processing:
-
Zero divided by zero results in NAN.
-
Any positive value divided by zero results in +INF.
-
Any negative value divided by zero results in -INF.
-
Zero multiplied by +/-INF results in NAN.
-
Any value added to, subtracted from, multiplied by, divided by, or divided from NAN results in NAN.
-
Any value compared to NAN (<, <=, ==, >=, >) results in 0. NAN != NAN.
-
Any value compared to +INF is less than +INF, except that +INF == +INF
-
Any value compared to -INF is greater than -INF, except that -INF == -INF
-
Any value added to or subtracted from +INF results in +INF
-
Any positive value multiplied by +/-INF results in +/-INF
-
Any value divided by +/-INF results in 0