Table of Contents (Start)
Threshold Browser
This documentation applies to NMS version 5.4. An online version of the software can be found here.
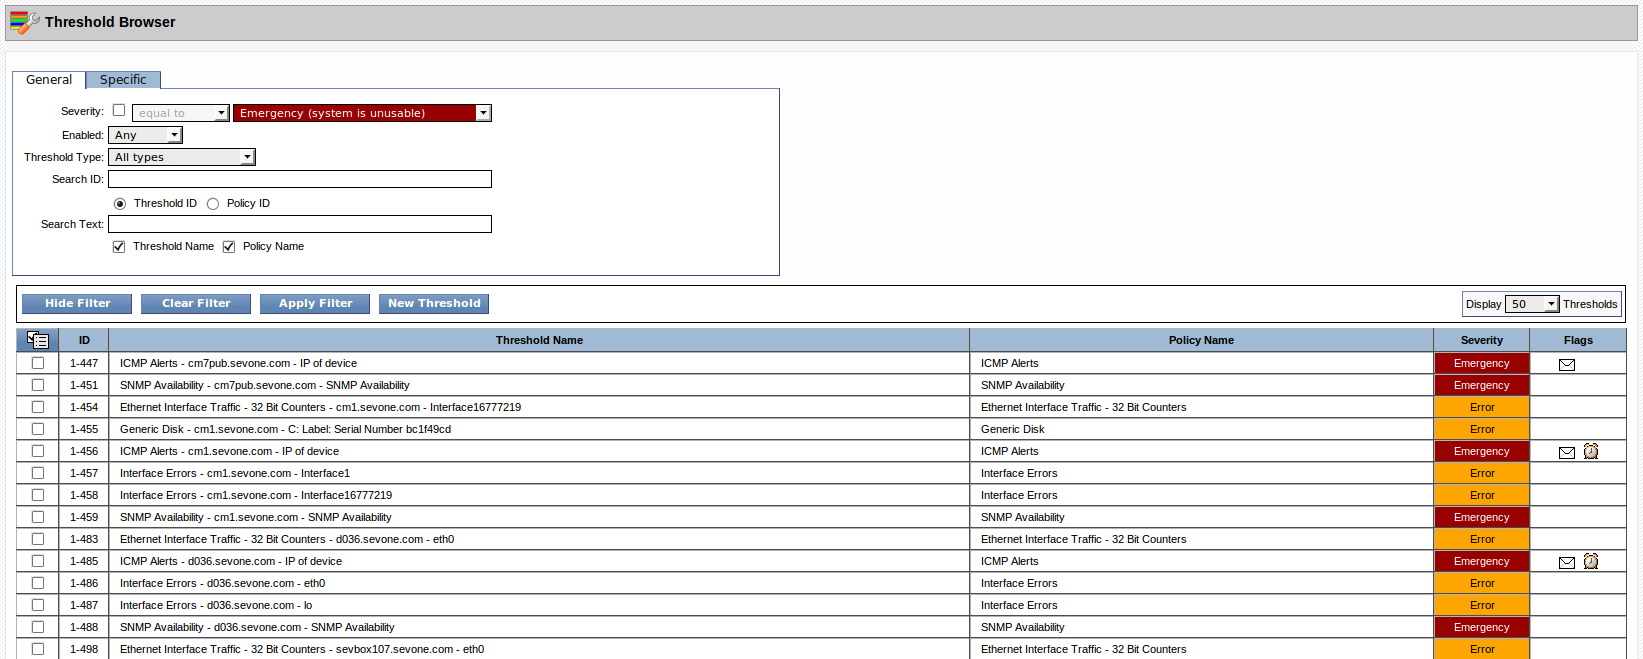
The Threshold Browser enables you to manage thresholds. A threshold is the value that triggers an alert or a trap. The Threshold Browser enables you to define stand alone thresholds to apply to a single device. The Policy Browser enables you to create thresholds that apply to multiple devices.
To access the Threshold Browser from the navigation bar, click the Events menu, select Configuration, and then select Threshold Browser.
The Welcome Dashboard provides a Thresholds link to access the Threshold Browser.

Manage Thresholds
The list provides the following tools and information.
-
Click New Threshold to create a new threshold on the Threshold Editor.
-
Click a threshold name to display the Threshold Editor.
-
ID - Displays the internal threshold identifier. Format: 1-111 (Peer ID – Threshold ID)
-
Threshold Name - Displays the threshold name.
-
Policy Name - Displays the name of the policy that created the threshold. Displays Stand Alone when the threshold was not created from a policy.
-
Severity - Displays the severity level for alerts the threshold triggers.
-
Flags - Displays flags when you define the threshold to be emailed or to be scheduled.
-
 - Email
 -
 - Schedule
-
Select the check box for each threshold to manage, click  , and select one of the following options.
-
Select Delete Selected to delete the thresholds you select.
-
Select Disable Selected to disable the thresholds you select. Disabled thresholds display in light text and do not trigger alerts or traps.
-
Select Enable Selected to enable the thresholds you select.
Threshold List Filters
Filters enable you to limit the thresholds that appear in the list. Filters are optional and cumulative.
-
Click Show Filter to display controls that enable you to filter the list.
-
Click Apply Filter to apply the filter settings.
-
Click Clear Filter to remove all filters and to display all thresholds in the list.
-
Click Hide Filter to collapse the Filter section.
General Filters
In the Filters section, the General tab provides the following filters.
-
Select the Severity check box, then click the drop-down and select a comparison operator. Click the second drop-down and select a severity.
-
Click the Enabled drop-down.
-
Select Any to display both enabled and disabled thresholds.
-
Select Enabled to display only thresholds that are enabled.
-
Select Disabled to display only thresholds that are disabled.
-
-
Click the Threshold Type drop-down.
-
Select All Types to display thresholds that meet the other filter criteria.
-
Select Stand Alone (Custom) to display thresholds that are not associated with a policy.
-
Select Policy Based to display thresholds that policies create.
-
-
In the Search ID field, enter the threshold identifier and select the Threshold ID option or enter the policy identifier and select the Policy ID option.
-
In the Search Text field, enter text that appears in the threshold name and/or the policy name and select the corresponding Threshold Name and/or Policy Name check box.
Specific Filters
The Specific tab provides the following filters. Most selections are dependent on the preceding selection.
-
Click the Device drop-down and select the device that contains the indicator for the threshold you seek.
-
Click the Plugin drop-down and select the plugin that polls the indicator.
-
Click the Object drop-down and select the object that contains the indicator.
-
Click the Indicator drop-down and select the indicator that triggers the threshold.